
After data suggested a pool current at the Rio Olympics, and then the Canadian age-group meet in Windsor, I’ve gotten into the habit of just browsing the distance freestyle results to see if anything particularly odd pops out. The Pro Swim Series stopped in Bloomington this weekend and led off with the 1500m on Friday. Scroll through to the 7th seed, Jake Mitchell, and his splits looked somewhat idiosyncratic:
7 Jake Mitchell 17 Carmel Swim Club 15:36.21 15:56.67 754
r:+0.67 28.87 1:00.63 (31.76)
1:31.90 (31.27) 2:03.72 (31.82)
2:35.26 (31.54) 3:07.27 (32.01)
3:31.85 (24.58) 4:10.95 (39.10)
4:33.36 (22.41) 5:14.63 (41.27)
5:46.26 (31.63) 6:18.28 (32.02)
6:50.11 (31.83) 7:22.46 (32.35)
7:54.32 (31.86) 8:26.74 (32.42)
8:58.67 (31.93) 9:31.14 (32.47)
10:02.66 (31.52) 10:35.28 (32.62)
11:07.11 (31.83) 11:39.78 (32.67)
12:11.77 (31.99) 12:44.35 (32.58)
13:16.38 (32.03) 13:48.88 (32.50)
14:21.04 (32.16) 14:53.54 (32.50)
15:25.44 (31.90) 15:56.67 (31.23)
Ignore the two splits faster than 25 and the two around 40s, those are obvious errors. But the nice thing about this two-column format of splits is that you can clearly see that one column is a bunch of 31 highs and the other column is a bunch of 32 mids. That’s… interesting. Looking across at the other side of the pool to the 8th seed, Graham Barrett, and you get:
13 Graham Barrett 20 Univ Louisville 15:44.68 16:24.69 692
r:+0.59 30.10 1:02.17 (32.07)
1:35.12 (32.95) 2:07.84 (32.72)
2:41.02 (33.18) 3:13.57 (32.55)
3:46.93 (33.36) 4:19.62 (32.69)
4:52.90 (33.28) 5:25.45 (32.55)
5:58.68 (33.23) 6:31.37 (32.69)
7:04.57 (33.20) 7:37.13 (32.56)
8:10.19 (33.06) 8:42.48 (32.29)
9:15.60 (33.12) 9:47.87 (32.27)
10:20.79 (32.92) 10:53.51 (32.72)
11:26.40 (32.89) 11:59.07 (32.67)
12:32.50 (33.43) 13:05.74 (33.24)
13:39.27 (33.53) 14:12.69 (33.42)
14:46.43 (33.74) 15:19.63 (33.20)
15:52.74 (33.11) 16:24.69 (31.95)
A bunch of 33s on the left, and 32s on the right. Curious. This becomes more obvious if you plot them (removing the erroneous splits):
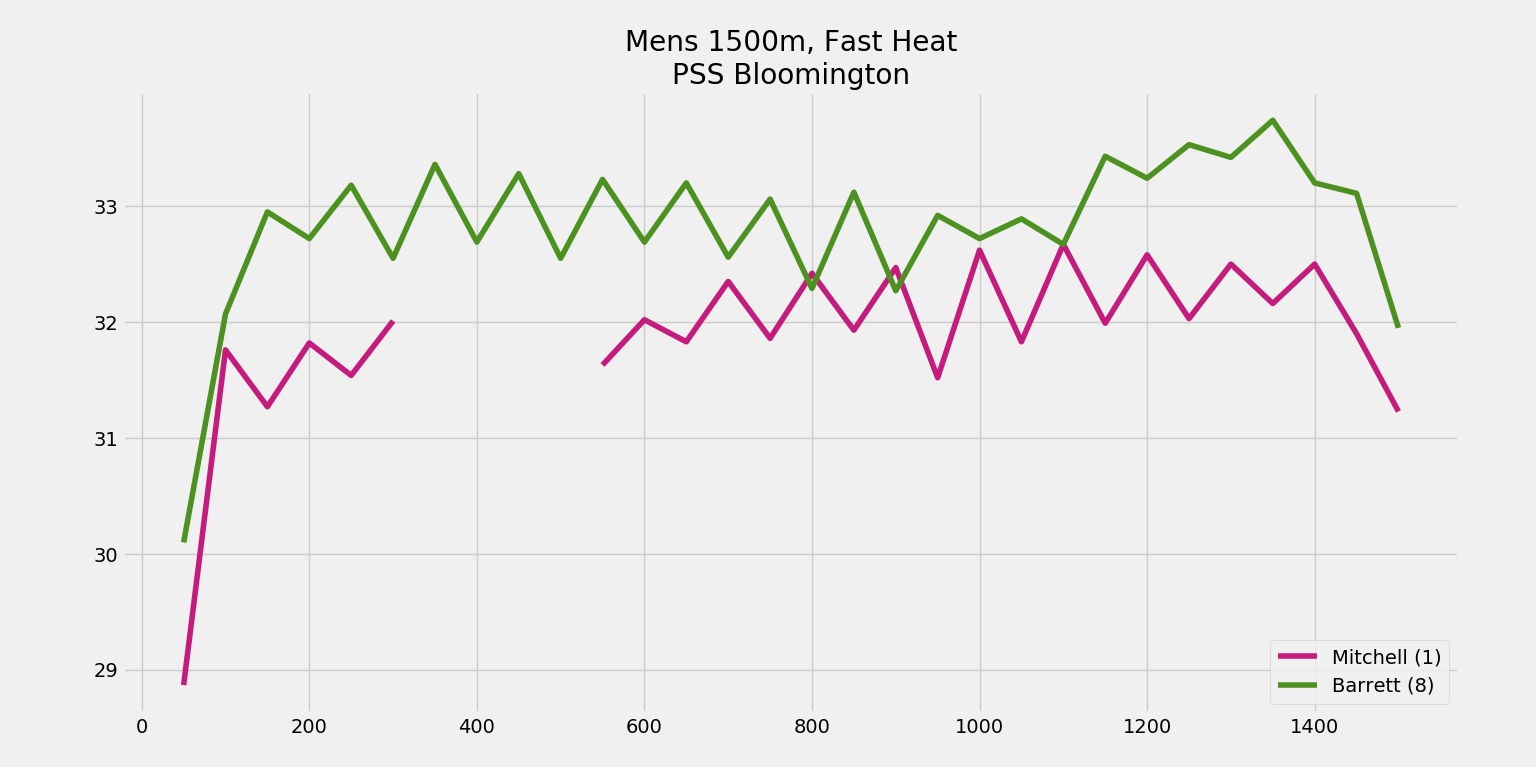
We see these clear, regular, opposing zig-zags. Barrett goes significantly faster one way, Mitchell goes significantly faster the other way… consistently throughout the race. This is the same kind of pattern we’ve seen in the past, so let’s explore this in some more depth.It’s difficult to look at everyone’s splits together since we have a pretty wide range in times, from Zane Grothe‘s 15:17 to Camryn Barry‘s 17:44. One way to equalize them is to change our way of thinking. I’ll use Marcelo Acosta as an example. Dropping his first 100m, since I want to focus on the part of the race that we expect to be more consistent, his splits are 30.79, 30.91, 31.15, 31.42, 31.59, 31.12, etc. I’ll first convert the times into speeds in units of cm/s (so this becomes 162.39, 161.76, 160.51, 159.13, 158.28, 160.67, etc.). And then rather than looking at the speeds directly, I’ll look at the consecutive changes in speed. That is, I don’t care how fast you swim a particular lap – just how much your speed changes from one lap to the next. For Acosta, that becomes -0.63, -1.24, -1.38, -0.86, +2.39, etc. I will also go ahead and invert every other 50 (making our data +0.63, -1.24, +1.38, -0.86, etc.) – this inversion makes the opposing zig-zags in the top chart all be on the same side of zero (all positive for Mitchell, all negative for Barrett).
Let’s establish some expectations. What do we expect these directionally-adjusted speed changes to look like over the course of a mile? Well, they’re distance swimmers – so we’d expect some sort of consistency. For those that choose to even split their races, we’d expect something that wobbles around zero without too many outliers. For those that negative split, at some point they’ll start increasing their speed – but because I’m inverting every other 50, those larger magnitudes would also basically just wobble around zero. And the same is true for those who positive split. We might see the occasional larger speed change, but basically oscillating around zero in some sense.
Naturally then, if I plot those speed changes for the top heats of the mens and womens 1500m in Bloomington, you’d see just a bunch of noise around zero and you wouldn’t be able to differentiate much of anything. Which is why the following chart is very interesting to me:
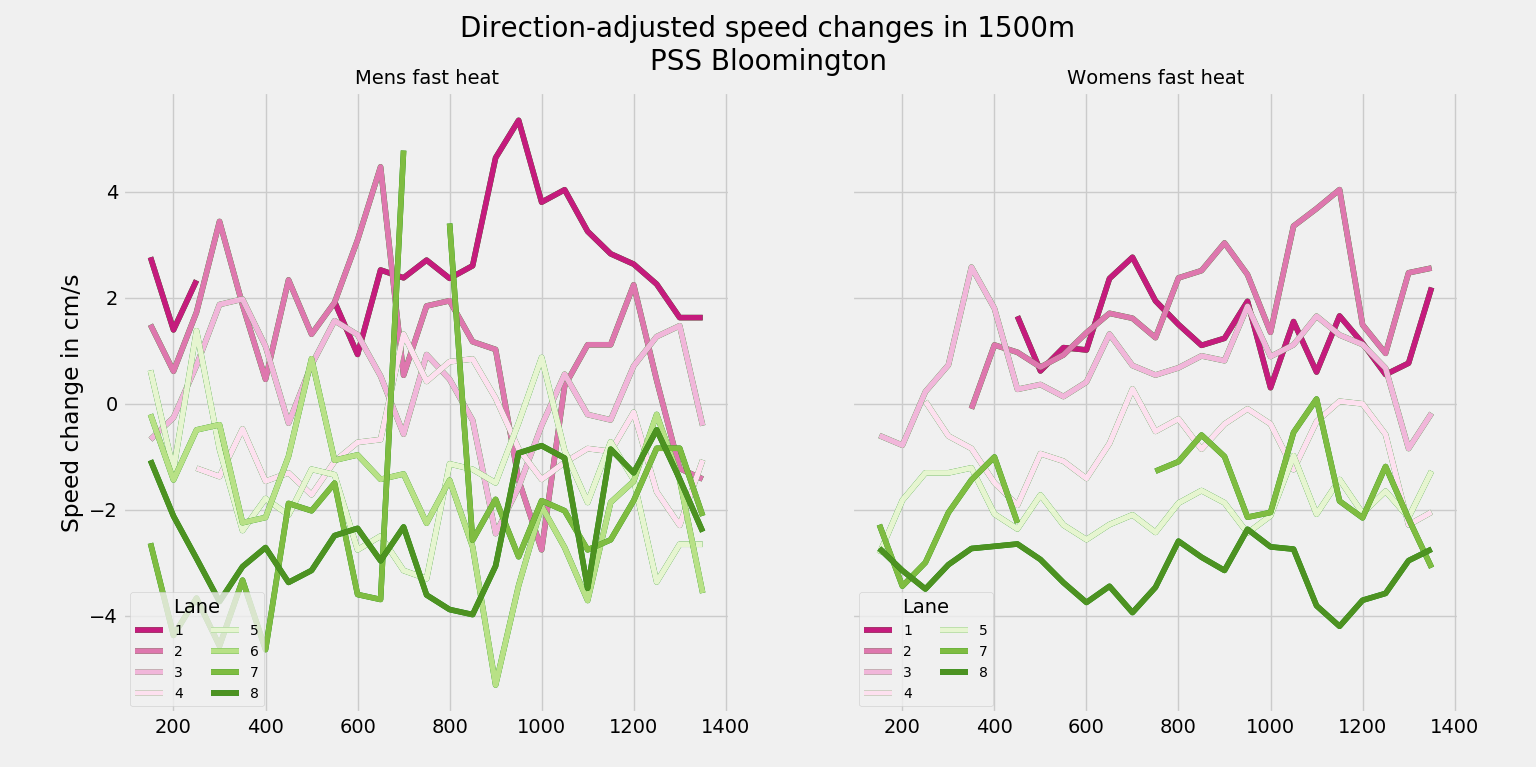
First, for whatever reason, Cierra Runge‘s splits were just total nonsense. I don’t know how that happened, but I thought it best to just remove her from the dataset entirely rather than try to figure out which of her splits were real and which were not. There are several other individual splits that are removed for similar reasons.
Now, I colored the eight lanes from pink (lane 1) to green (lane 8), and you can see something very interesting and quite surprising. The green lines tend to the bottom and the pink lines all tend to the top – many with consistent, non-zero values. All I’m doing is looking at speed changes for the top heat – and that has somehow led to this nearly perfect sorting by lane!
This is in stark contrast to the other big meet going on this weekend: the Atlantic Classic. Here is what the top mens heat looked like in the 1500 at that meet:

More or less total chaos around zero, no clear differentiation between the colors, as expected.
The next step is to look at more data. Thankfully, at this meet, we had not only the 1500m free but also the 400m free (heats and finals) and the 800m free. I took every swim from all of those races and, after dropping the opening and closing 100m of each, looked at the distribution of direction-adjusted speed changes by lane. Again, we’d surely expect this distribution to be zero, and we’d surely expect the lane to have no effect on this distribution. But that’s not what we get:

This is a similar chart to one I’ve presented for other meets in the past, and has a similarly large effect. As you move from lane 1 to lane 8, with each lane we see an extra 0.7cm/s push in either direction. To get a sense of what this number means, if you were to perfectly even split 31.0s 50s in lane 4, I would expect that solely as a result of the lane change, you would split alternating 30.87s and 31.14s in lane 5, 30.73s and 31.27s in lane 6, all the way up to 30.47s and 31.55s in lane 8. That’s a large effect, but it also has a lot of predictive power. Lane change alone explains 48.7% of the variance and the pvalue I see is comically small: 3 x 10^-234 (the pvalue represents the probability that given NO effect, you would still see data that looked like this. This is a vanishingly small probability), due to the large sample size (1600+ data points) and the significant effect presentation.
Let’s take a look at this in a completely different way. Instead of the longest events, let’s take a look at the shortest events. Just the 50s. With the 50s, we only get one length of the pool, so any kind of current effect wouldn’t have the opportunity to even out. It’d just be either a benefit or a penalty. Just looking at one swim isn’t enough though, but what I can do is track a swimmer from prelims through finals as they change lanes. The expectation is that people generally swim faster in finals than in prelims, and the lane really doesn’t matter at all. I’d expect that if you look at the difference in lane, it would not explain any of the variance in the change in speed. But that’s not the case:

This includes the A and B finals of each of the mens and womens 50s, for a total of 128 data points. And once again, we see this fairly strong drift as swimmers move further towards the outside. With each lane they move, they get about 0.4cm/s slower – an amount that explains 27% of the variance (with a very low pvalue, 1e-10). Different events, different measurement strategy – same result.
This is not normal. Unfortunately, it’s becoming that way.
The Charlotte downtown pool where they used to hold the Ultra Swim meet back in the early 2000s was the same way. The lanes closest to the stands always had the fastest 50 times. Same pool that Tom Dolan set the 200 Fly world record in.. although he was in the middle of pool for that.
Tom Malchow
You’re right… oops. Dolan was the IMer.
Easy way to find out: in an empty pool put some dye at both suspected areas and see if it moves in different directiions.
I was at open water nationals and I think there was a current there. I demand an analysis!
But for real though lane 6 at that country club pool had one heck of a current. Did some fast 50s going 9.9 to the feet one way then 13 high on the way back. No distance swimmer ever was 9.9 to the feet from a push.
It would be interesting to see this addressed with the Richmond pool (also a Myrtha pool). I can tell you from my experience that there is a major current in lanes 7-8, especially around mid pool.
Way back in 1981 or so, when the Schroeder Aquatics Center near Milwaukee, WI was hosting national meets it was discovered that they had a current. Theirs was a Whitten Gutter pool as was “mine”, completed in 1981. Because the Whitten inlet jets were installed at an angle (“to aid skimming”) it created a rotational current around the perimeter of the pool. It was so extreme that our AD could float around the perimeter of our pool on an inner tube with no arm or leg movements.
Solution? I simply got a large diameter bolt, wedged it into each inlet and rotated each inlet back to pointing straight down. Voila, no current from then on.
No idea if… Read more »
Came for the anecdote, stayed for the glorious pun.
No surface current but there was still turbulence in the water created by the inlet. The deeper the pool the less the issue, but it is still there. If the filter system is on you will always have some type of current or turbulence. Just need to try and reduce as much as possible.
Maybe there was a current at GT……at least for Caleb on that last 50 of 2fly and second 50 of 100 free! 😉
We had the same problem at the University of Michigan. We solved it by cutting the flow rates down during meets.
We’ve heard of this as a solution in past issues – turn the pumps off while racing, and the problem goes away.
All of this reminded me I’m not very good with numbers. Maybe put a rubber ducky in the pool and watch which way it travels?
If my previous comment passes moderation check you will find compete support of your point.