
With NCAA’s beginning soon, it’s worth setting expectations about how the field as a whole will perform. The simplest way to do this is to look at how swimmers in the past have performed at this meet. I looked at swimmers performance vs their seeds at this meet for the last 7 years (2011-2017).
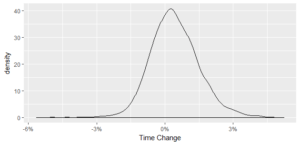
The first metric was time change. Swimmers at this meet add an average of .4% to their seed times with a standard deviation of 1.1% (5034 data points). 35% of swimmers beat their seed times. 65% were the same or slower. There is essentially no correlation between performance vs seed and how well you are seeded. Top swimmers perform basically the same as lower seeded swimmers.
Overall distribution
Negative is faster positive is slower
Vs Seed
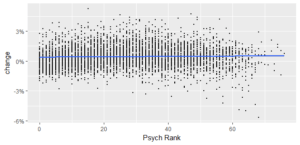
Besides time change we can also look at the expected placing of swimmers in each seed. Swimmers with the highest ranks tended to finish closer to their seeded places. This doesn’t happen because of the obvious reason that it’s hard for a higher seeded swimmer to move up (not many places to improve into) so their place is naturally more stable. Instead it’s because these top swimmers don’t move down as far. The top seeds finish with an average rank of 2.2. A difference of 1.2 from their original rank. 8th seeds finish with an average rank of 12.2 a difference of 4.2.
This is because the stablest seeds of the data set are those with a large time gap to anyone else (ex. Katie Ledecky 1650). These are concentrated in top seeds for obvious reasons.
There is no place in the top 16 where the average points scored by that seed are higher than the seeded points. This isn’t to say that teams with higher seeds will inevitably drop points. Last year’s second biggest point gaining team was Texas A&M. Texas A&M were seeded 6th on the psych sheet last year. Members of a single team are generally on the same taper plan, so their performance is correlated. Higher seeded teams dropping points is more common. For example, last year’s top seeded teams Stanford and Cal dropped the 2nd and 5th most points.
Expected Points

Psych Rank Performance
| Rank | Move Up/Hold Rank | Average Points | Average Finish |
| 1 | 53% | 17.9 | 2.2 |
| 2 | 52% | 15.9 | 3.4 |
| 3 | 42% | 14.1 | 5.0 |
| 4 | 44% | 12.7 | 6.2 |
| 5 | 54% | 12.0 | 7.1 |
| 6 | 39% | 10.0 | 9.3 |
| 7 | 55% | 9.6 | 10.1 |
| 8 | 36% | 7.2 | 12.2 |
| 9 | 43% | 7.1 | 12.3 |
| 10 | 47% | 6.5 | 12.8 |
| 11 | 49% | 5.7 | 14.1 |
| 12 | 50% | 4.9 | 15.1 |
| 13 | 48% | 4.4 | 15.9 |
| 14 | 47% | 3.4 | 18.1 |
| 15 | 42% | 3.1 | 18.7 |
| 16 | 60% | 3.2 | 18.5 |
| 17 | 43% | 2.4 | 21.3 |
| 18 | 44% | 1.7 | 22.0 |
| 19 | 45% | 1.7 | 23.5 |
| 20 | 37% | 1.2 | 24.9 |
| 21 | 39% | 1.0 | 24.7 |
| 22 | 46% | 1.4 | 24.6 |
| 23 | 44% | 0.6 | 26.4 |
| 24 | 47% | 0.6 | 27.5 |
| 25 | 55% | 0.9 | 25.5 |
I rescored the psych sheet with the expected score curve shown above for individual swimming events. I left the relays with their psych sheet points. No diving. There are a couple races where top swimmers are probably not given enough credit as they deserve by this average. Katie Ledecky with a score of 17.7 in the mile seems incorrect, but it shouldn’t much affect the general conclusions.
This only accounts for psych sheet rank. Not seed time differentials, or team taper histories are accounted for.
| Psych Expected | Psych Expected Standard Dev | Psych Points | |
| Stanford | 483.5 | 25.2 | 527.5 |
| California | 343.4 | 21.0 | 366.5 |
| Texas A&M | 296.2 | 22.8 | 338 |
| Michigan | 262.9 | 21.5 | 289.5 |
| Tennessee | 196.1 | 14.8 | 195.5 |
| Southern Cali | 177.7 | 16.3 | 185 |
| Louisville | 173.1 | 15.8 | 173.5 |
| Virginia | 160.1 | 16.6 | 160 |
| Texas | 145.3 | 16.0 | 153 |
| Indiana | 132.9 | 13.3 | 137.5 |
| Ohio St | 118.5 | 13.5 | 124 |
| Auburn | 117.9 | 14.1 | 124 |
| Minnesota | 117.0 | 12.4 | 114 |
| Georgia | 101.9 | 17.7 | 101 |
| Kentucky | 91.2 | 16.7 | 104.5 |
| Wisconsin | 85.7 | 8.5 | 92 |
| NC State | 70.5 | 12.5 | 69.5 |
| University of Missouri | 58.4 | 14.5 | 63 |
| UNC | 32.7 | 8.8 | 37 |
| Alabama | 29.1 | 7.3 | 25.5 |
| Arizona | 25.1 | 8.7 | 17 |
| Virginia Tech | 22.6 | 7.8 | 23 |
| Penn St | 20.4 | 6.5 | 20 |
| Purdue | 16.1 | 8.3 | 18.5 |
| Florida St | 15.3 | 7.5 | 13.5 |
| Arizona St | 13.6 | 8.8 | 16 |
| Hawaii | 13.6 | 8.3 | 13 |
| South Carolina | 13.0 | 8.1 | 13.5 |
| Florida | 12.6 | 8.2 | 4 |
| Eastern Michigan University | 12.0 | 5.1 | 15 |
| Denver | 11.5 | 7.8 | 15 |
| UCLA | 11.2 | 8.5 | 6 |
| Duke | 10.7 | 8.5 | 4 |
| Pittsburgh | 4.3 | 4.9 | 0 |
| West Virginia | 3.9 | 5.1 | 4 |
| Notre Dame | 3.3 | 4.0 | 0 |
| Akron | 3.1 | 5.0 | 2 |
| SMU | 2.4 | 3.9 | 0 |
| Northwestern | 1.9 | 2.9 | 0 |
| Harvard | 1.9 | 3.8 | 0 |
| Florida Intl | 1.4 | 3.6 | 0 |
| Pacific | 1.3 | 2.8 | 0 |
| Houston | 1.2 | 2.5 | 0 |
| Iowa | 1.1 | 3.2 | 0 |
| Liberty University | 1.1 | 2.1 | 0 |
| Georgia Tech | 1.0 | 2.0 | 0 |
| U of Utah Swimming | 0.8 | 1.6 | 0 |
| U.S. Navy | 0.7 | 1.8 | 0 |
| Nebraska | 0.5 | 1.8 | 0 |
| Rutgers | 0.5 | 2.0 | 0 |
| UNLV W | 0.5 | 1.5 | 0 |
| Northeastern University | 0.4 | 1.9 | 0 |
| Florida Gulf Coast University | 0.4 | 1.5 | 0 |
| Yale | 0.3 | 1.4 | 0 |
| Rice | 0.3 | 1.8 | 0 |
| Drexel | 0.2 | 1.6 | 0 |
| Arkansas | 0.2 | 1.8 | 0 |
| San Diego St | 0.2 | 1.3 | 0 |