We’re now a ways out from women’s NCAA’s, but that doesn’t mean we have to stop breaking down the meet. I’ve already looked at individual performance and team scoring in depth, so now it’s time to start looking at time performance.
The men’s version of this article was published Wednesday. View it here if you’re interested.
Of the top teams, Stanford had the best meet against their seed times. They added .01% on average to their seed times across 51 events. The only team better with more than 10 swims at the meet was NC State who dropped an average of .16% from their seeds in 20 events. The field as a whole added an average of .57% to their seed times. This was higher than the average from the last 7 years of .45% and the worst performance vs seed since 2013. The complete team by team performance table is at the bottom of the article.
| Year | Average Time Change vs Seed | Host |
| 2011 | 0.44% | Texas |
| 2012 | 0.29% | Auburn |
| 2013 | 0.62% | Indianapolis |
| 2014 | 0.44% | Minneapolis |
| 2015 | 0.32% | Greensboro |
| 2016 | 0.48% | Georgia Tech |
| 2017 | 0.43% | Indianapolis |
| 2018 | 0.57% | Ohio St |
The change in the average this year does not appear to be explainable by a large number of outliers like the shift in the men’s data was. Instead there was a slight shift to the right in the overall time change distribution vs pre 2018 time changes:

I don’t know what the explanation for this slight shift is. I would love to hear some theories in the comments. Does it have to do with the timing of certain conference meets? The temperature of the pool? The meet schedule? Am I reaching here and seeing a trend were I should be seeing random noise (quite possibly)? Something else?
Nationals performance vs seed time is an interesting metric, but there are a lot of things it doesn’t tell us. It can’t tell us much about how much a team improved. To get a better idea, I compared nationals and season best times to swimmer’s best time in those events during previous year’s conference or national meets. Of teams with 20 or more swims at the meet Virginia dropped the most time from previous years based on their season best times (1.87% faster on average) and their nationals times (1.44% faster). If we look at teams with 10 or more swims, the best performing team by season best improvement was another ACC team North Carolina who dropped an average of 2.19%. The average season best for all swimmers at nationals was 1.1% faster than their previous season best time. Nationals time were on average .4% faster than swimmer’s previous season best times.
Of course, this a huge selection bias problem here. This improvement is not representative of sport wide improvement at all. Swimmers who got worse were less likely to qualify for the meet in the first place. To get a better idea of overall improvement, I’ll be doing an update to this post with nationals data included.
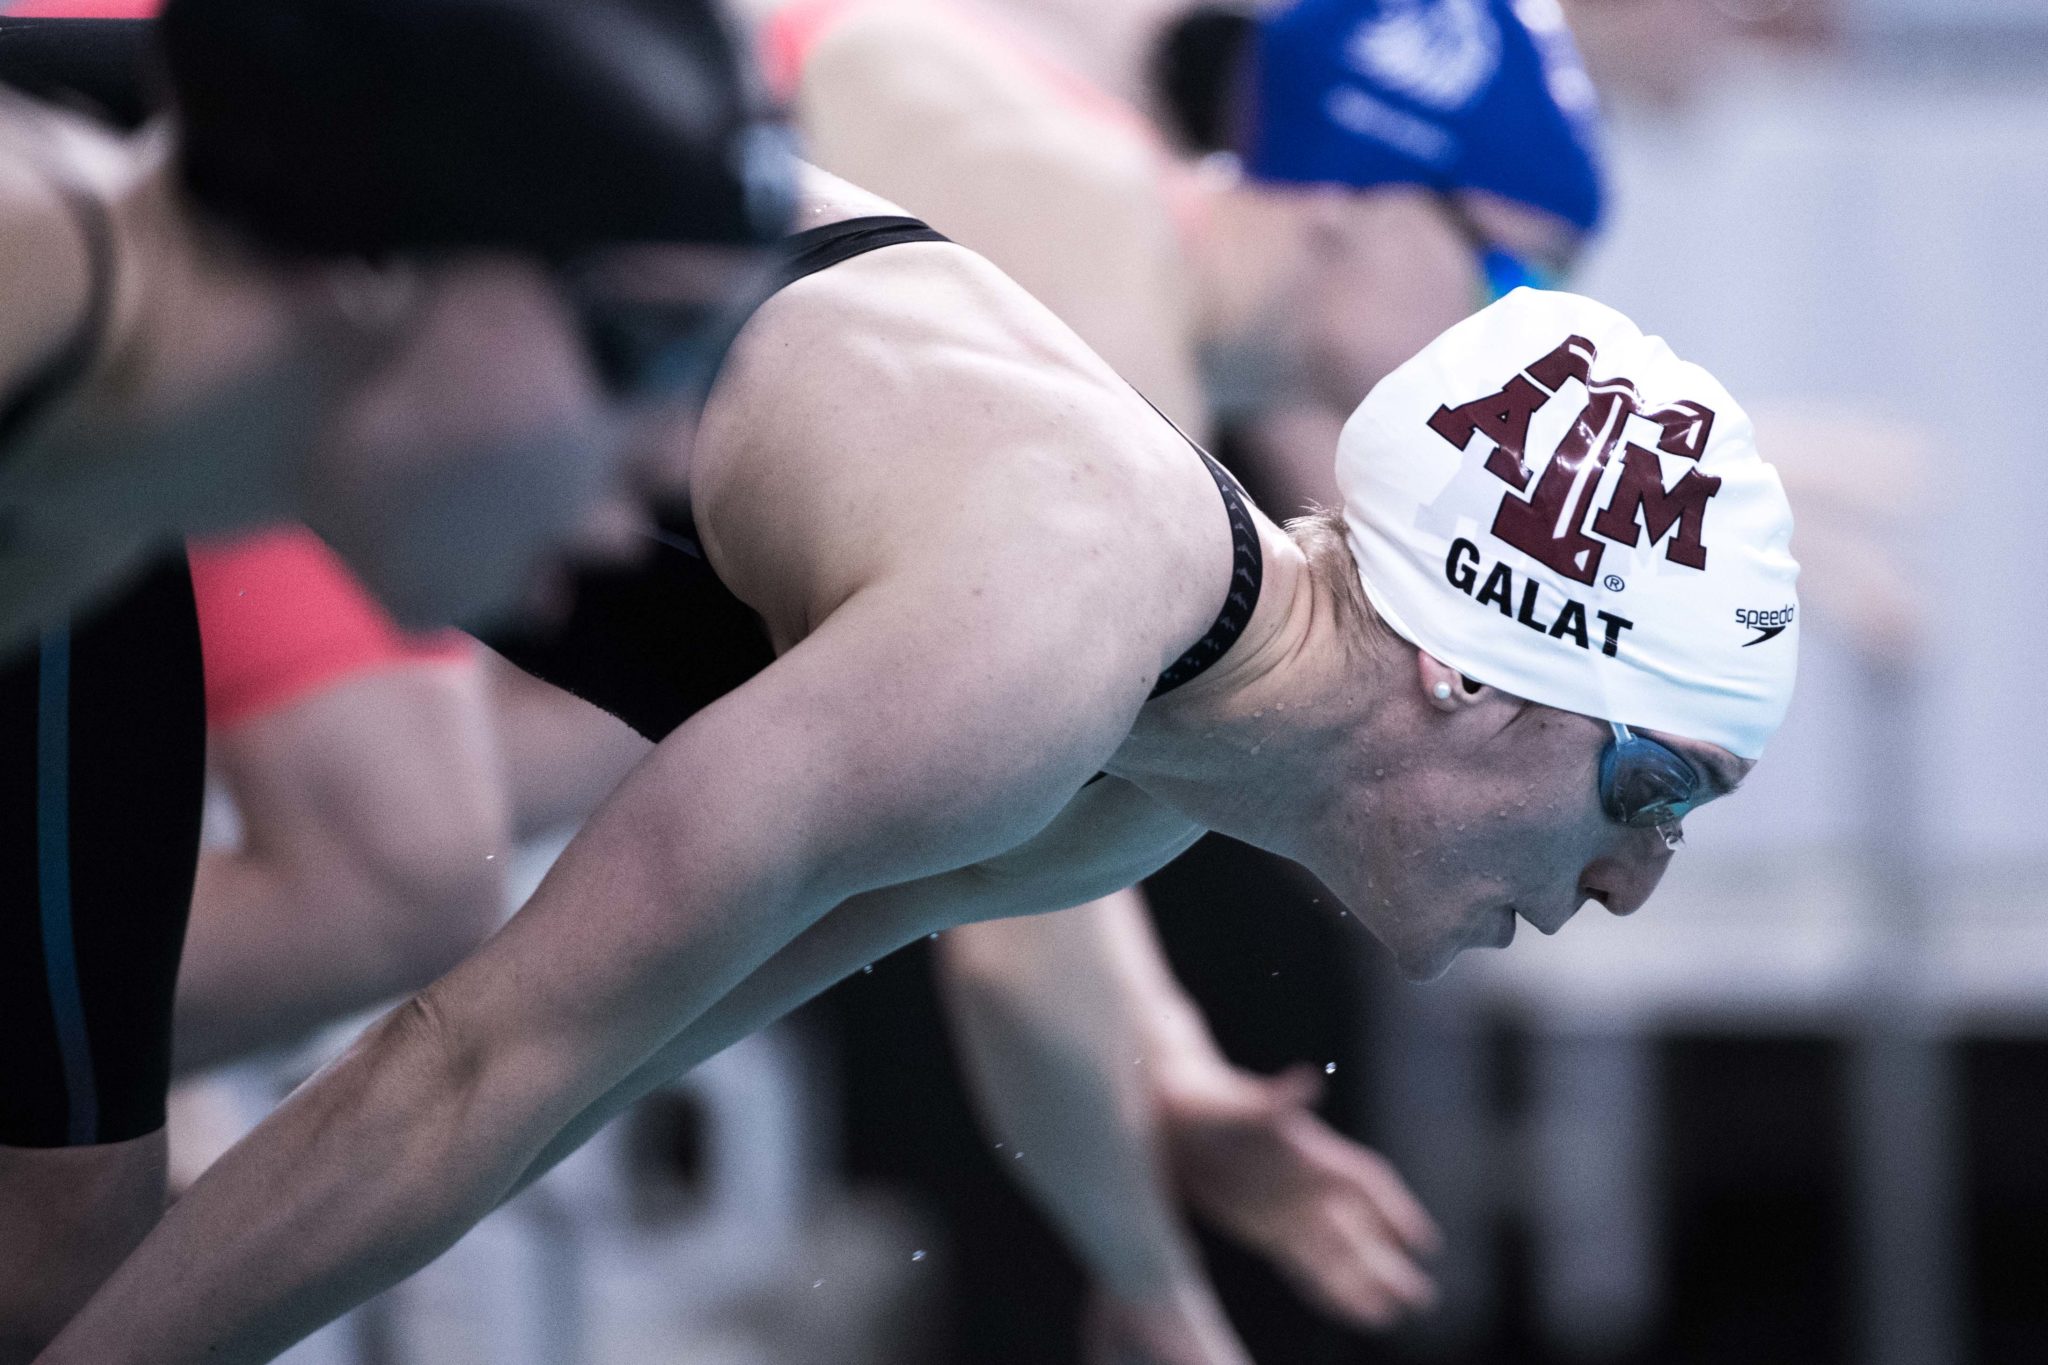
The biggest individual drop vs seed time at the meet came from Bethany Galat in the 200 breast who dropped 2.6% (2:06.52->2:03.26). There were only 6 drops of over 2% at the entire meet. Next biggest were Elise Haan of NC State in the 100 free dropping 2.5% (49.77->48.52), Maddie Hess of Duke in the 100 free dropping 2.5% (50.42->49.18), and Ella Eastin of Stanford in the 200 IM dropping 2.3% (1:53.24->1:50.27).
The biggest time add at the meet came from Heidi Vanderwel of Yale whoe added 4.9% to her 100 back (4.9%). However her season best time was better than her previous season best time in that event by .64%. This pattern repeats itself among the biggest time adds. The 43 largest time adds to seed at the meet all were either freshmen (and therefore didn’t have times from previous seasons) or beat their previous season’s best time, some by wide margins. People who appear on the biggest time adds list tend to be people who really nailed their first taper and couldn’t repeat it a second time. For example, Katie Coughlin of Wisconsin’s 200 back was 4.2% slower than seed, but her Big 10’s time in the event was 2.2% faster than her previous PR. The top and bottom individual time changes are in the tables below the team time change data.
Team Time Change Data
Negative is faster. Positive is slower. This data is from events swum at nationals only. A team’s season best vs their previous season collegiate best times is for entries at nationals only. Does not include events only contested at earlier meets.
| Nats vs Seed | # of Nats Swims | Swim Points Change vs Psych | Season Best vs Previous Season Best | Nats vs Previous Season Best | |
| Stanford | 0.01% | 51 | 50.5 | -0.69% | -0.36% |
| Texas A&M | 0.59% | 45 | -39 | -1.20% | -0.44% |
| Michigan | 0.44% | 30 | -29.5 | -0.39% | 0.31% |
| Louisville | 0.38% | 29 | 58.5 | -1.15% | -0.53% |
| Virginia | 0.33% | 28 | 1 | -1.87% | -1.44% |
| Kentucky | 0.40% | 28 | -7.5 | -1.44% | -1.00% |
| California | 0.16% | 27 | 6.5 | -0.37% | -0.01% |
| Tennessee | 0.30% | 27 | -27 | -1.60% | -1.19% |
| Southern Cali | 0.95% | 26 | -58 | -0.05% | 0.91% |
| Georgia | 0.50% | 26 | 34 | -0.66% | -0.13% |
| Florida | 0.85% | 24 | -1 | -0.94% | 0.20% |
| Missouri | 0.39% | 22 | 23 | -1.30% | -0.54% |
| Texas | 0.59% | 21 | 17.5 | -0.35% | 0.34% |
| NC State | -0.16% | 20 | 0.5 | -1.47% | -1.13% |
| Minnesota | 0.83% | 19 | -4 | -0.96% | -0.24% |
| Auburn | 0.29% | 19 | -41.5 | -1.58% | -1.10% |
| Duke | 0.80% | 17 | -2 | -1.53% | -0.54% |
| Indiana | 0.28% | 17 | -3.5 | -0.82% | -0.45% |
| Arizona | 0.49% | 17 | 16 | -1.20% | -0.88% |
| Ohio St | 0.54% | 16 | -17 | -0.87% | -0.31% |
| UCLA | 1.09% | 13 | 2 | -1.16% | -0.05% |
| UNC | 1.10% | 12 | -5 | -2.19% | -1.28% |
| Arizona St | 1.46% | 12 | 1 | -0.98% | 0.46% |
| Florida St | 1.18% | 11 | -12.5 | -1.13% | -0.48% |
| Purdue | 0.46% | 11 | 13.5 | -1.56% | -0.96% |
| Alabama | 0.98% | 11 | -2.5 | -1.11% | -0.41% |
| Wisconsin | 0.58% | 10 | -14 | -1.75% | -1.44% |
| Notre Dame | 0.89% | 9 | 4 | -0.94% | -0.22% |
| Houston | 1.59% | 9 | 0 | -1.26% | 0.23% |
| Virginia Tech | 0.95% | 8 | -9 | -0.23% | 0.78% |
| South Carolina | 0.11% | 8 | -0.5 | -1.16% | -0.74% |
| Akron | 0.90% | 6 | 4 | -0.77% | -0.69% |
| Denver | 1.05% | 6 | 5 | -1.85% | -0.66% |
| Pittsburgh | 1.42% | 5 | 0 | -0.63% | 0.79% |
| West Virginia | 0.38% | 5 | -2 | -2.19% | -1.79% |
| Hawaii | 0.43% | 5 | 3.5 | -1.97% | -1.35% |
| SMU | 1.00% | 4 | 0 | -0.19% | 0.79% |
| Rutgers | 1.48% | 4 | 0 | -0.10% | 2.30% |
| Liberty | 0.39% | 4 | 0 | -1.09% | -0.98% |
| Georgia Tech | -0.11% | 3 | 0 | -0.57% | -0.45% |
| Penn St | -0.37% | 3 | 6 | -1.72% | -1.57% |
| Northwestern | 1.09% | 3 | 0 | ||
| Northeastern | 0.73% | 3 | 0 | -4.56% | -3.86% |
| Florida Intl | 2.01% | 3 | 0 | -0.81% | 1.18% |
| Harvard | 1.41% | 3 | 0 | -1.25% | 0.15% |
| Eastern Mich | -0.04% | 3 | 0 | -2.87% | -2.87% |
| U.S. Navy | 0.45% | 3 | 0 | -0.31% | 0.36% |
| Iowa | 0.45% | 2 | 0 | -1.84% | -1.24% |
| Nebraska | -0.07% | 2 | 0 | ||
| Florida Gulf | 1.69% | 2 | 0 | ||
| Drexel | 0.47% | 2 | 0 | -1.42% | -0.51% |
| Rice | 1.53% | 2 | 0 | -0.25% | 1.28% |
| Yale | 3.07% | 2 | 0 | -0.69% | 2.35% |
| Pacific | 2.10% | 2 | 0 | -1.44% | 0.64% |
| UNLV | 1.23% | 2 | 0 | -0.19% | 1.03% |
| Utah | 2.14% | 2 | 0 | -0.46% | 1.65% |
| Arkansas | 0.14% | 2 | 0 | ||
| San Diego St | 1.09% | 1 | 0 | -4.45% | -3.41% |
Individual Time Change
Biggest Drops
| Name | Year | School | Event | Seed Time | Nats Time | Time Chage at Nationals | Season Best vs Previous Season Best |
| Galat, Bethany | Senior | Texas A&M | 200 Breastroke | 2:06.52 | 2:03.26 | -2.58% | -3.58% |
| Haan, Elise | Junior | NC State | 100 Freestyle | 49.77 | 48.52 | -2.51% | -3.35% |
| Hess, Maddie | Junior | Duke | 100 Freestyle | 50.42 | 49.18 | -2.46% | -1.50% |
| Eastin, Ella | Junior | Stanford | 200 IM | 1:53.24 | 1:50.67 | -2.27% | -1.49% |
| Barksdale, Emma | Junior | South Carolina | 200 Breastroke | 2:13.08 | 2:10.16 | -2.19% | -0.87% |
| McLaughlin, Katie | Junior | California | 200 Butterfly | 1:54.97 | 1:52.64 | -2.03% | -0.57% |
| Nero, Bailey | Junior | Auburn | 200 IM | 2:00.84 | 1:58.60 | -1.85% | 0.52% |
| Duncan, Delaney | Junior | Eastern Mich | 200 Breastroke | 2:11.13 | 2:08.80 | -1.78% | -3.89% |
| Galat, Bethany | Senior | Texas A&M | 200 IM | 1:55.16 | 1:53.17 | -1.73% | -1.47% |
| Manuel, Simone | Senior | Stanford | 100 Freestyle | 46.43 | 45.65 | -1.68% | -1.53% |
| King, Lilly | Junior | Indiana | 200 Breastroke | 2:04.68 | 2:02.60 | -1.67% | -1.15% |
| Valls, Kyla | Freshman | Virginia | 50 Freestyle | 22.92 | 22.54 | -1.66% | |
| Gastaldello, Beryl | Senior | Texas A&M | 100 Freestyle | 47.77 | 46.98 | -1.65% | -1.07% |
| Marrkand, Jen | Senior | Virginia | 500 Freestyle | 4:39.52 | 4:35.21 | -1.54% | |
| Marrkand, Jen | Senior | Virginia | 200 Butterfly | 1:53.55 | 1:51.81 | -1.53% | -2.86% |
| Engel, Lindsey | Senior | Stanford | 50 Freestyle | 22.79 | 22.45 | -1.49% | -1.32% |
| Hu, Janet | Senior | Stanford | 100 Butterfly | 51.27 | 50.56 | -1.38% | 0.36% |
| Thompson, Sarah | Freshman | Missouri | 100 Freestyle | 49.94 | 49.26 | -1.36% | |
| Comerford, Mallory | Junior | Louisville | 200 Freestyle | 1:41.17 | 1:39.80 | -1.35% | -1.87% |
| Baker, Kathleen | Junior | California | 200 IM | 1:52.70 | 1:51.25 | -1.29% | -1.32% |
| Dressel, Sherridon | Sophomore | Florida | 50 Freestyle | 22.77 | 22.48 | -1.27% | -0.62% |
| Pfeifer, Evie | Freshman | Texas | 400 IM | 4:08.47 | 4:05.32 | -1.27% | |
| Holub, Tamila | Freshman | NC State | 500 Freestyle | 4:43.74 | 4:40.22 | -1.24% | |
| Hu, Janet | Senior | Stanford | 50 Freestyle | 21.91 | 21.65 | -1.19% | -1.99% |
| Kelsoe, Katie | Junior | Alabama | 100 Backstroke | 53.74 | 53.12 | -1.15% | -1.15% |
Biggest Adds
This methodology misses transfer’s times at their old schools from previous seasons. However, I fixed Katie Coughlin‘s (an Alabama->Wisconsin transfer) times in the table below manually (she went to my high school, I made an exception).
| Name | Year | School | Event | Seed Time | Nats Time | Time Chage at Nationals | Season Best vs Previous Season Best | Nats Time vs Previous Season Best |
| Vanderwel, Heidi | Senior | Yale | 100 Backstroke | 52.45 | 55.04 | 4.94% | -0.64% | 4.26% |
| Padington, Mackenzie | Freshman | Minnesota | 100 Freestyle | 48.45 | 50.5 | 4.23% | ||
| Coughlin, Katie | Junior | Wisconsin | 200 Backstroke | 1:54.03 | 1:58.81 | 4.19% | -2.23% | 1.87% |
| Scott, Riley | Junior | Southern Cali | 200 IM | 1:55.63 | 2:00.40 | 4.13% | -0.97% | 3.12% |
| Maughan, Amelia | Senior | Florida | 200 Freestyle | 1:44.49 | 1:48.73 | 4.06% | -0.18% | 3.87% |
| Stone, Jamie | Freshman | Arizona | 100 Butterfly | 52.81 | 54.91 | 3.98% | ||
| Ross, Marlies | Junior | Arizona St | 400 IM | 4:07.65 | 4:17.34 | 3.91% | -0.63% | 3.25% |
| Yuskova, Ksenia | Senior | Houston | 200 Freestyle | 1:44.88 | 1:48.98 | 3.91% | -0.89% | 2.99% |
| Earley, Erin | Freshman | Virginia | 200 Backstroke | 1:53.16 | 1:57.36 | 3.71% | ||
| Anderson, Jordan | Junior | Utah | 400 IM | 4:08.31 | 4:17.03 | 3.51% | -1.47% | 1.99% |
Little things make BIG things happen
Of note, Katie coughlin had some issues with her wedge on the start of that 200 back. Accounts for some of the gain