Since men’s nationals wrapped up a couple weekends ago, I’ve looked at team scoring, individual performances, and team’s future prospects. Now it’s time to look at some time performance stats from the meet. Compared to seed time, this was a pretty average year. The distribution of time changes vs seed lines up very closely with the distribution of time changes from the last 4 national meets.

On average swimmers added .01% (standard deviation 1.25%) to their seed times; effectively an average of 0 change. This is in contrast to the last 4 years where swimmers added an average of .2% (standard deviation 1.26%) to their seed times (article on historical data). The best year previously vs seed was last year at an average of .16% slower than seed, and each of the last 4 years had averaged between .16%-.23% time added. .01% is noticeably lower. The median moved as well. The median time change the last 4 years was .17%; this year it was .06%. That’s not a huge shift in magnitude, but over this many data points (2359 for the last 4 years, 591 this year), it’s unlikely due to random noise either.
| Time Change vs Seed | |
| 2014 | 0.22% |
| 2015 | 0.18% |
| 2016 | 0.23% |
| 2017 | 0.16% |
| 2018 | 0.01% |
So, why the change this year despite the highly similar overall distributions? What was different this year? The obvious first thing to check is if there are huge outliers skewing the data. Caeleb Dressel, an outlier in all things, seems to fit the bill. His 100 fly was 8.7% faster than his seed time (46.89->42.8) and his 50 free was 5.5% faster than his seed time (18.66->17.63). No one else dropped more than 4% from their time in any event. However, removing Dressel’s massive drops completely from the dataset only raises the average time change to .03%, still noticeably lower than in previous years. That’s not too surprising. With 591 data points, the mean is pretty robust and a single outlier can’t explain the median shift.
The instead of a single outlier, the answer lies in the overall number of extreme values. This year only 5 swims were over 3% slower than their seed time. The previous 4 years there were 45 swims, or 11.25 per year, more than 3% slower than seed. Similarly, this year there were 12 swims more than 3% faster than seed. The past 4 years there were 18 swims, or 4.5 per year, more than 3% faster than seed. That level of change at the margins is enough to explain the change in the mean and most of the median shift. Given that the change in the average is so reliant on extreme values, the change is probably due to swimmer specific effects rather than some overall trend in the sport. Dressel messing around at conference and the injuries to John Shebat and Gunnar Bentz are one off things.
While overall performance at this meet was pretty typical, at a nationals meet, the specifics matter. This meet is the culmination of team’s training cycles and performing well here can make or break swimmer’s seasons. With that in mind, let’s dive into the team level data.
Indiana had the best meet vs seed of any team with more than 10 swims at the meet. They dropped an average of .54% from their seed times on 20 individual swims. Florida were next dropping an average of .52% on 39 swims. Top teams Cal and Texas also performed well. Texas dropped an average of .4% on 40 swims, and Cal dropped .46% on 45 swims.
Performance vs seed isn’t a perfect stat. It’s possible for a team to have a brilliant season and perform terribly at nationals. For example, Texas A&M added an average of 1.02% to their seed times at nationals on 18 swims. However, comparing their season bests in events they swam at nationals to their collegiate bests from conference or nationals in those events from previous seasons, they dropped an average of 1.62%, a huge amount of time. Clearly they peaked at SEC’s and came back to Earth a bit at nationals. Comparing their nationals times to their previous season collegiate best times, they dropped an average of .73% despite their poor performance vs seed. This was still above average. The average swim at nationals was .4% faster than a swimmer’s previous season collegiate best. Swimmer’s season best times in their nationals events were an average of .8% faster than their previous season best times.
Other teams whose season best times in their nationals events stacked up well to their previous season best times were Virginia (2.02% faster), Florida State (2.63% faster), Indiana (1.62%), Missouri (1.42%), and NC State (1.41%). Teams do a lot of swims during the season that should be used to judge their team wide improvement that aren’t in events competed at nationals. The data in this article is incomplete. To get a better answer to the overall improvement question, I’m planning an update to this article with nationals data included.
One level below the team improvement data is the individual data. Dressel, as mentioned above, had the two largest time drops vs seed of the meet at 8.7% in the 100 fly and 5.5% in the 50 free. Next were Carter Grimes of Missouri who dropped 4.8% in the 200 IM (1:51.84->1:46.53), Sam Pomajevich of Texas who dropped 4.2% in the 500 free (4:23.48->4:12.46), and Nick Thorne of Arizona who dropped 4.2% in the 200 free (1:38.28->1:34.17). The full top 25 list of swimmer improvements vs seed is in the table below the team time change data table.
Even adding big time wasn’t a sign of a bad season. Of the ten biggest time adds, 4 were from non freshmen and all of their season best times were faster than their previous season best times. They simply peaked at an earlier meet.
Team Time Change Data
Negative is faster. Positive is slower. This data is from events swum at nationals only. A team’s season best vs their previous season collegiate best times is for entries at nationals only.
| Nats vs Seed | # Nats Swims | Swim Points Change vs Psych | Season Best vs Collegiate Best | Nats vs Collegiate Best | |
| California | -0.46% | 45 | 97 | -0.52% | -0.24% |
| Texas | -0.40% | 40 | 46 | -0.33% | -0.01% |
| Stanford | -0.17% | 39 | 75.5 | -0.61% | -0.29% |
| Florida | -0.52% | 38 | 45 | -0.71% | -0.35% |
| Michigan | 0.29% | 32 | -50 | -0.81% | -0.40% |
| NC State | -0.04% | 30 | 0 | -1.41% | -1.08% |
| Virginia | 0.30% | 25 | -27 | -2.02% | -1.77% |
| Georgia | -0.16% | 25 | 79.5 | -0.32% | -0.11% |
| South Carolina | 0.31% | 21 | -24 | 0.11% | 0.56% |
| Indiana | -0.54% | 20 | -26.5 | -1.62% | -1.54% |
| Louisville | -0.16% | 20 | 4 | -0.79% | -0.53% |
| Auburn | 0.60% | 20 | -49.5 | -0.88% | -0.62% |
| Texas A&M | 1.02% | 18 | -49 | -1.69% | -0.73% |
| Arizona | -0.43% | 16 | 3.5 | -1.11% | -0.83% |
| Southern Cali | -0.49% | 16 | 74 | 0.20% | 0.25% |
| Missouri | -0.32% | 15 | -18 | -1.42% | -1.11% |
| Tennessee | -0.12% | 15 | -13.5 | -0.43% | 0.06% |
| Arizona St | 0.14% | 14 | 2 | -0.27% | 0.18% |
| Alabama | 0.12% | 12 | -6 | -0.21% | 0.13% |
| Harvard | 0.05% | 12 | -19 | -1.09% | -0.64% |
| Florida St | -0.08% | 10 | -11 | -2.63% | -2.25% |
| Ohio St | 0.81% | 9 | -55 | -1.01% | 0.03% |
| Virginia Tech | 0.12% | 8 | -7 | -1.17% | -0.89% |
| Notre Dame | 0.44% | 8 | -11.5 | -0.48% | 0.03% |
| West Virginia | 0.83% | 7 | -5.5 | -1.00% | -0.33% |
| Yale | 0.19% | 7 | 0 | -0.51% | -0.08% |
| Denver | 0.02% | 7 | 22 | -1.03% | -0.50% |
| Grand Canyon | 1.48% | 7 | -20 | -0.74% | 0.74% |
| Georgia Tech | 0.37% | 7 | -9 | 0.65% | 1.40% |
| UCSB | 0.08% | 6 | 0 | -1.97% | -1.57% |
| Minnesota | 0.45% | 5 | -42 | -1.76% | -1.23% |
| Hawaii | -0.74% | 5 | 6 | -0.67% | -0.67% |
| Towson | 0.35% | 3 | 11 | -2.37% | -1.60% |
| Utah | 1.22% | 3 | 3 | -1.63% | -0.43% |
| GWU | 0.84% | 3 | 0 | -1.24% | -0.38% |
| Penn | 1.11% | 3 | -2 | -0.71% | 0.58% |
| Kentucky | 0.21% | 3 | -2 | -0.78% | -0.57% |
| Wisconsin | 0.91% | 3 | 0 | -0.13% | 0.91% |
| UNC | 0.89% | 2 | 0 | -1.03% | -0.16% |
| Cornell | -0.50% | 2 | 2 | -1.34% | -1.33% |
| Iowa | 0.87% | 2 | 2 | -0.61% | 0.25% |
| Loyola MD | -0.18% | 2 | -5 | -0.45% | -0.09% |
| Purdue | 0.40% | 2 | 0 | 1.49% | 2.02% |
| Missouri St. | 0.20% | 2 | -12 | ||
| UNLV | 2.41% | 2 | -2 |
Individual Biggest Drops vs Seed
If the entry for a swimmer’s ‘Season Best vs Collegiate Best’ is empty, it mean’s they didn’t have a time in that event during a previous college season at a conference or nationals meet. This eliminates the possibility of giving swimmer’s credit for ‘improving’ when all they did was taper an event for the first time.
| Name | Class | School | Event | Seed Time | Nationals Time | Nats vs Seed | Season Best vs Collegiate Best | |
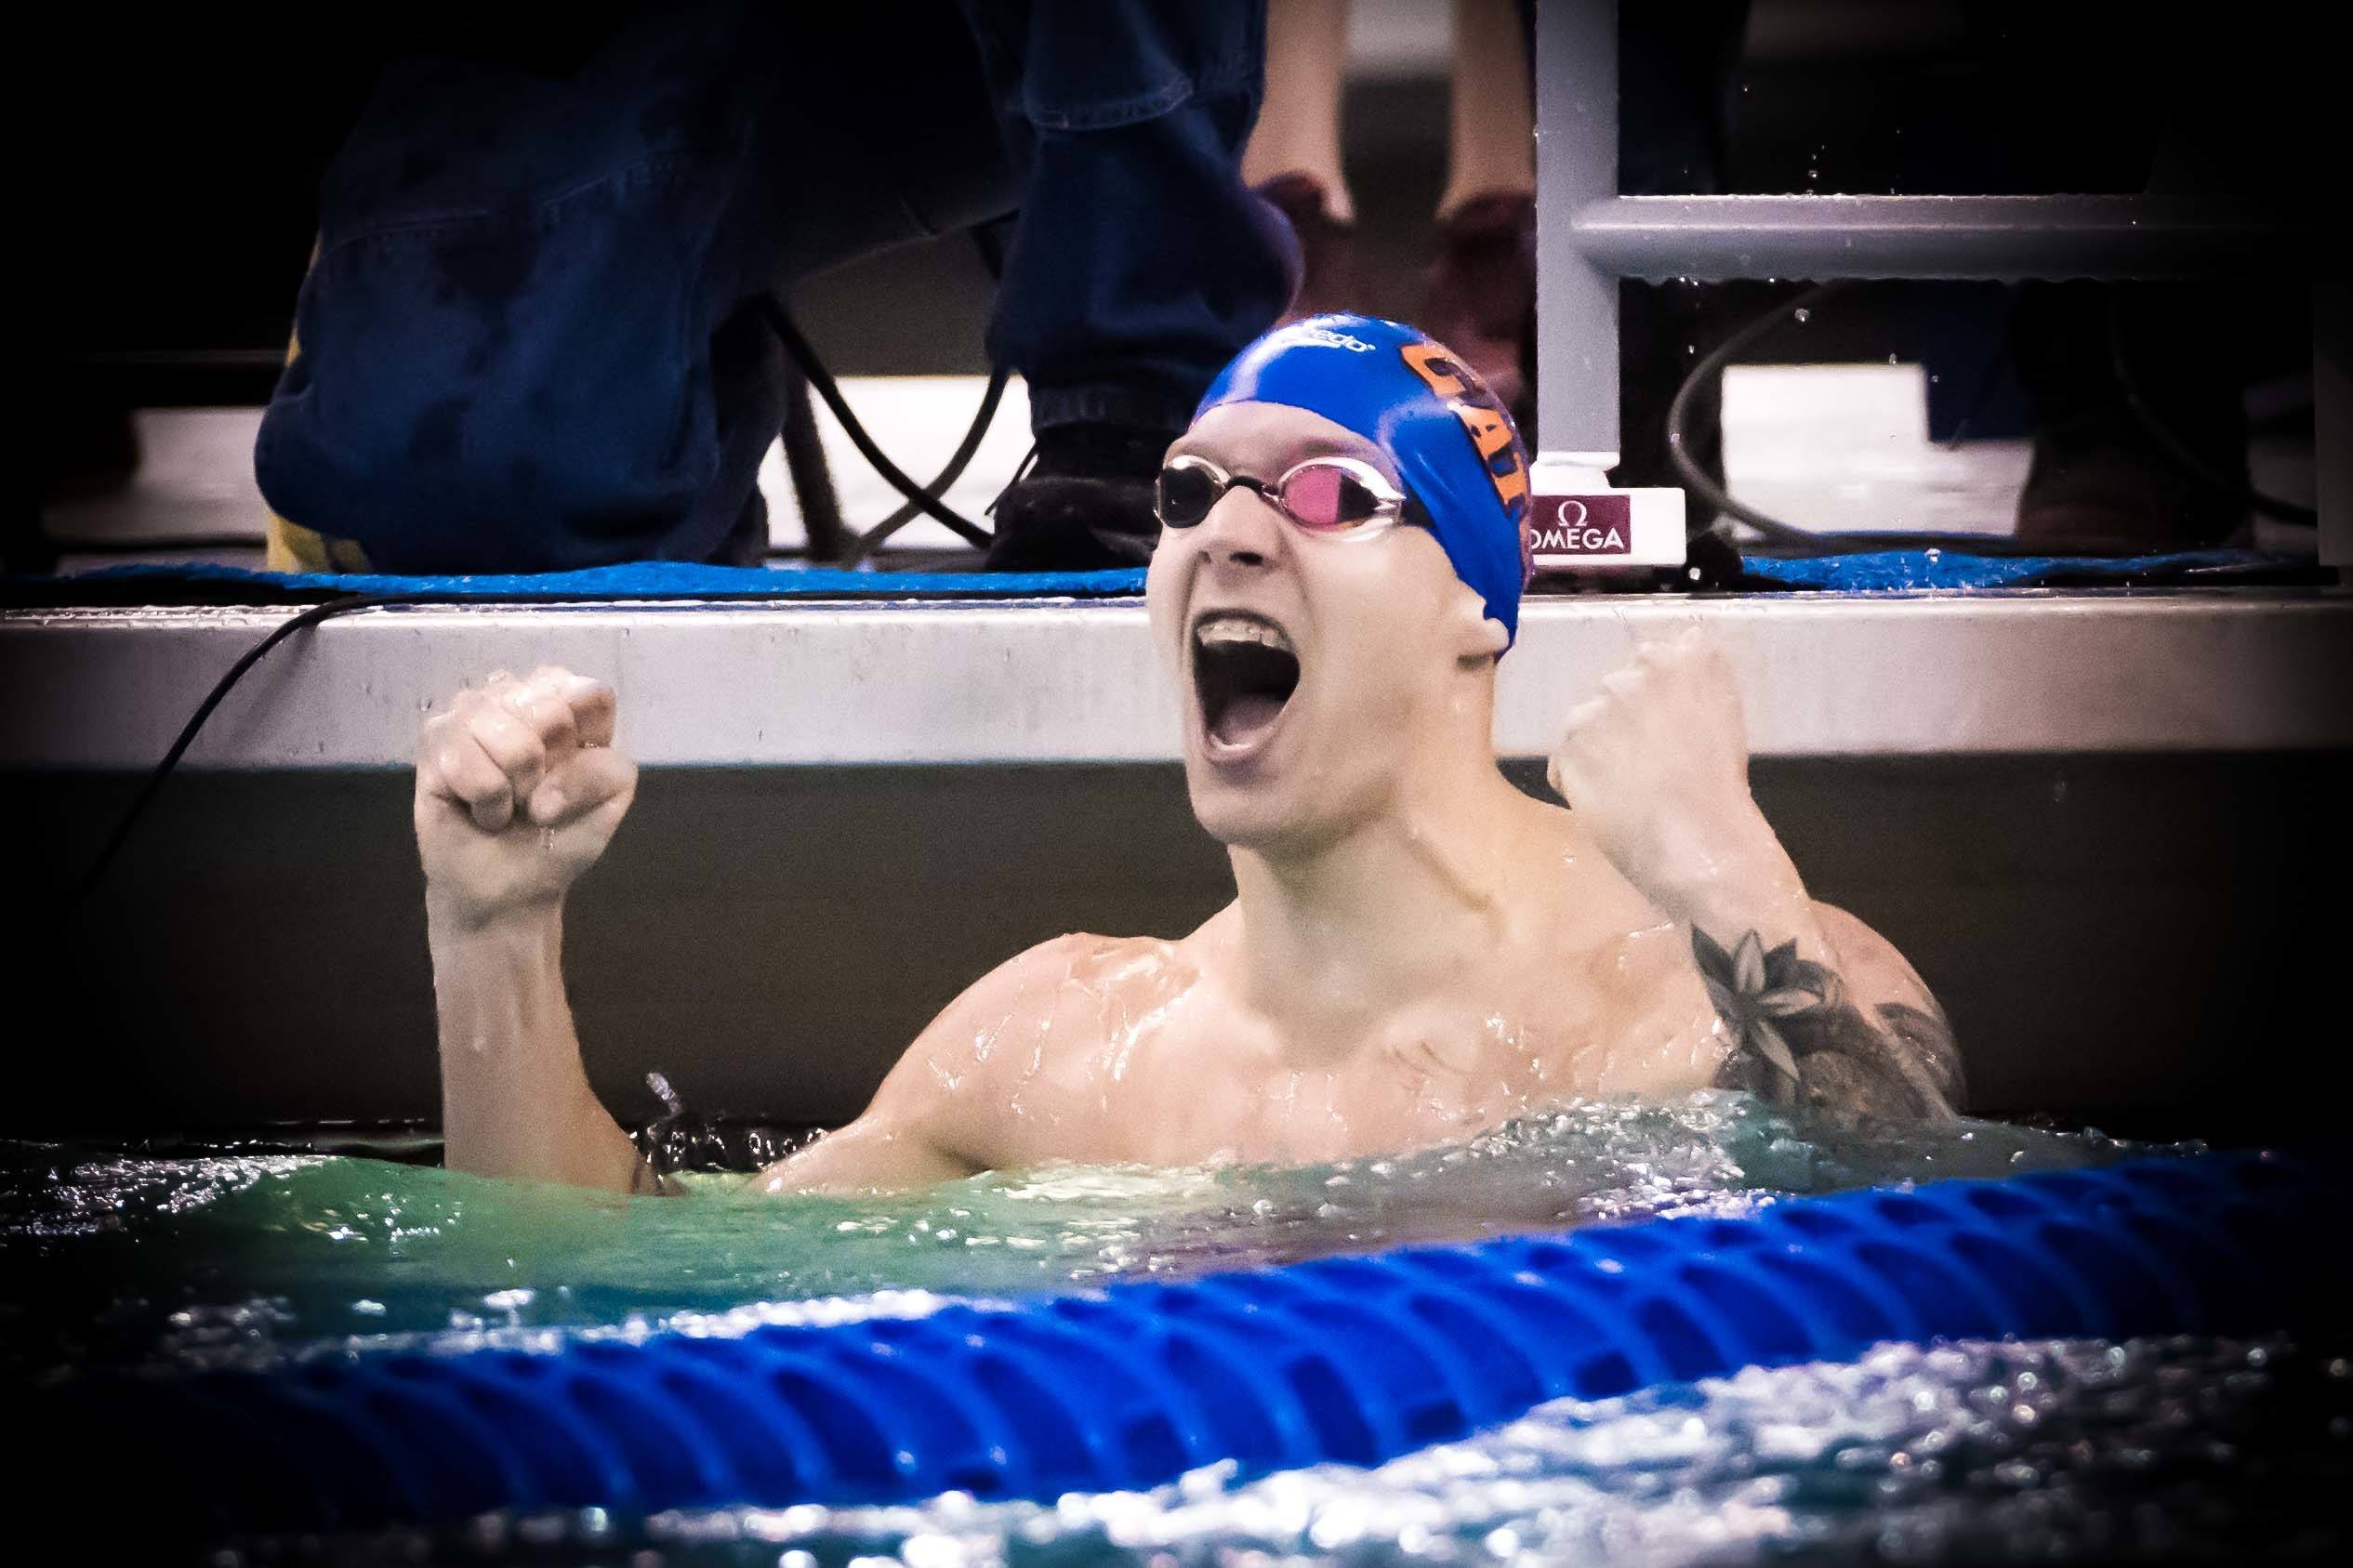
| 1 | Dressel, Caeleb | Senior | Florida | 100 Butterfly | 46.89 | 42.8 | -8.72% | -1.79% |
| 2 | Dressel, Caeleb | Senior | Florida | 50 Freestyle | 18.66 | 17.63 | -5.52% | -3.13% |
| 3 | Grimes, Carter | Freshman | Missouri | 200 IM | 1:51.84 | 1:46.53 | -4.75% | |
| 4 | Pomajevich, Sam | Freshman | Texas | 500 Freestyle | 4:23.48 | 4:12.46 | -4.18% | |
| 5 | Thorne, Nick | Senior | Arizona | 200 Freestyle | 1:38.28 | 1:34.17 | -4.18% | |
| 6 | DeVine, Abrahm | Junior | Stanford | 400 IM | 3:44.41 | 3:35.29 | -4.06% | -1.12% |
| 7 | Shebat, John | Junior | Texas | 200 Backstroke | 1:41.52 | 1:37.94 | -3.53% | 0.72% |
| 8 | Pieroni, Blake | Senior | Indiana | 50 Freestyle | 19.6 | 18.93 | -3.42% | -2.37% |
| 9 | Hoffer, Ryan | Freshman | California | 100 Butterfly | 46.4 | 44.93 | -3.17% | |
| 10 | McHugh, Sam | Senior | Tennessee | 400 IM | 3:47.05 | 3:39.90 | -3.15% | -0.34% |
| 11 | Haas, Townley | Junior | Texas | 200 Freestyle | 1:32.40 | 1:29.50 | -3.14% | -1.06% |
| 12 | Wielinski, Jacob | Junior | Missouri | 400 IM | 3:54.50 | 3:47.39 | -3.03% | |
| 13 | Haas, Townley | Junior | Texas | 100 Freestyle | 42.81 | 41.67 | -2.66% | -0.69% |
| 14 | Farris, Dean | Sophomore | Harvard | 50 Freestyle | 19.68 | 19.16 | -2.64% | |
| 15 | Shebat, John | Junior | Texas | 100 Backstroke | 45.76 | 44.59 | -2.56% | 0.54% |
| 16 | Vazaios, Andreas | Junior | NC State | 200 Freestyle | 1:33.70 | 1:31.32 | -2.54% | -2.13% |
| 17 | Bentz, Gunnar | Senior | Georgia | 400 IM | 3:44.60 | 3:38.90 | -2.54% | 1.06% |
| 18 | Harting, Zach | Junior | Louisville | 200 Freestyle | 1:35.48 | 1:33.16 | -2.43% | |
| 19 | Vazaios, Andreas | Junior | NC State | 200 IM | 1:42.43 | 1:39.97 | -2.40% | -0.79% |
| 20 | Dressel, Caeleb | Senior | Florida | 100 Freestyle | 40.87 | 39.9 | -2.37% | -0.25% |
| 21 | Mefford, Bryce | Freshman | California | 200 Backstroke | 1:40.84 | 1:38.48 | -2.34% | |
| 22 | Sos, Daniel | Freshman | Louisville | 200 Butterfly | 1:46.17 | 1:43.70 | -2.33% | |
| 23 | Haas, Townley | Junior | Texas | 500 Freestyle | 4:14.43 | 4:08.60 | -2.29% | -0.13% |
| 24 | Roberts, Jonathan | Senior | Texas | 400 IM | 3:43.72 | 3:38.64 | -2.27% | 0.21% |
| 25 | Switkowski, Jan | Senior | Florida | 200 IM | 1:41.83 | 1:39.54 | -2.25% | -1.61% |
Individual Biggest Adds vs Seed
| Name | Class | School | Event | Seed Time | Nationals Time | Nats vs Seed | Season Best vs Collegiate Best | |
| 1 | Gonzalez, Hugo | Freshman | Auburn | 400 IM | 3:35.76 | 3:46.19 | 4.83% | |
| 2 | Izzo, Giovanni | Freshman | NC State | 50 Freestyle | 19.37 | 20.06 | 3.56% | |
| 3 | Nikolaev, Mark | Junior | Grand Canyon | 200 Backstroke | 1:40.81 | 1:44.34 | 3.50% | -1.17% |
| 4 | Izzo, Giovanni | Freshman | NC State | 100 Freestyle | 42.69 | 44.06 | 3.21% | |
| 5 | Gonzales, Brad | Freshman | UNLV | 500 Freestyle | 4:19.44 | 4:27.36 | 3.05% | |
| 6 | Van Overdam, Austin | Junior | Texas A&M | 200 IM | 1:43.54 | 1:46.62 | 2.97% | -2.24% |
| 7 | Taylor, Michael | Freshman | Florida | 200 Backstroke | 1:40.28 | 1:43.10 | 2.81% | |
| 8 | Lense, Noah | Sophomore | Ohio St | 200 Butterfly | 1:40.83 | 1:43.66 | 2.81% | -0.60% |
| 9 | Olson, Tanner | Freshman | Texas A&M | 200 Breastroke | 1:53.87 | 1:57.01 | 2.76% | |
| 10 | Josa, Matthew | Senior | California | 200 Butterfly | 1:41.41 | 1:44.10 | 2.65% | -0.97% |
I think it would be really interesting to perform an analysis from year to year, from high school to college, and the four year improvements for each respective team. That would really provide some insight into which colleges have been improving their swimmers. I also believe that a full analysis of USA Swimming power points or some metrics like that, and the progression percentage wise or of raw points over the years would be great. If I were going into college soon, I would personally love to have data like that, and it would be a huge factor in my choice of a college for swimming, because it could be the best true indication of if I would really have… Read more »
Good stuff especially relating times to previous career bests. Have you done this analysis with NCAA results on the women’s side? Or did I just miss it?
Haven’t done the women yet. Working on that now. Should be up in a day or two.
ok sounds great!!
obviously some heavy sandbagging going on here in season…..
I think we need to take some of the huge drops in time that some people had with a grain of salt. For instance the 500 free seed time from Pomajevich and the 100 fly seed time of Dressel would not have even made the meet unless they had another event that they were rested in that made the meet. A lot of the big drop times were based on seed times done unrested in dual meets, with the majority of the small drop times done tapered, suited and shaved.
True, but regarding Pomajevich: yes, his 4:23 seed was an in-season B-cut, but he’d never been faster than 4:21 prior to college, so his 4:12s are legit baller drops.
This is different, in this instance, from Dressel, who everyone knows could have done the 46 seed in board shorts in September just to get a morning lane at NCs.
Actually, the big drops from seed times should be looked at as….big drops from seed times. For whatever the reason, those who had these big drops from seed time were able to qualify for the meet, in that event, with the time they were seeded with PERIOD
They did it within the NCAA entry rules and should be recognized for being one of those talented few who can do that.
No grains of salt, no excluding them from the data, etc. They are part of the data, within the definition of the statistic being factored…nothing more, nothing less….but impressive that they have the talent to put up qualifying times without a full taper and/ or shave!
I LOVE THAT!!!
Ouch, Hugo. Ouch.
Also, Florida State had one heck of an underrated season.