This article is number five in the series looking at how the times at the conference level have been changing in the last five years (2020-2024) for the Power 5 conferences and the Ivy League. It’s felt like times required to qualify, final and win have been coming down considerably recently, but how much does the data back this up?
We’ll be including the Pac-12, even though the conference swim & dive championships no longer exist.
- SEC Mens
- SEC Womens
- ACC Mens
- ACC Womens
- Pac-12 Men’s
- Pac-12 Women’s
- Big Ten Men’s
- Big Ten Women’s
- Big-12
- Ivy League
We’re looking back rather than forwards here. The Pac-12 Swimming and Diving Championships are no more, with the teams scattered to the other Power conferences. Stanford and Cal will resume their rivalry in the ACC, USC will join the Big Ten, and Arizona State will take Texas’ place as the heavyweight of the Big 12 alongside in-state rivals Arizona.
In the last few years of its existence, the Arizona State men had joined Cal and Stanford in the fight for the conference title and succeeded in winning the final two. While Cal has a tendency to save their taper for NCAAs, the Sun Devils take the approach of swimming fast at every meet and that’s led to some big drops at the top of some events. Further down the conference Arizona can be a bit of a dark horse – they beat Stanford in 2020 to take second behind Cal.
WHAT DATA ARE WE LOOKING AT?
We’ll look at the times required individually to make ‘A’ (8th), ‘B’ (16th) and ‘C’ (24th) finals (where they exist), as well as the winning time for each year. For relays, we’ll choose to look at 1st, 3rd and 8th. If there were fewer than eight teams competing, we would just take the times from 1st and 3rd. Other than the winning individual time, these will all be from heats.
WHAT ARE WE INTERESTED IN?
Have the times got faster, and is there a definitive trend in the times? The first of these is simple to work out – were last year’s times faster than in 2020 – but the second is a little trickier. How do we judge what is significant and what may be due to a single swimmer, à la Leon Marchand? To make this decision, we make use of something known as correlation- essentially how much of a link is there between two separate variables. In our case, the two variables are the year and the finishing time for each position.
A QUICK STATISTICS REFRESHER
The R-value is the measure of correlation and can take a value between -1 and 1. To get a sense of what an R-value means, there are three important values:
- An R-value of 1 would indicate that there is a perfectly linear positive relationship between the two (eg. each year the winning time increases by 0.5),
- An R-value of -1 would indicate a perfectly linear negative relationship (eg. each year the winning time decreases by 0.5).
- An R-value of 0 indicates that there is no relationship between the two – the winning time does not depend on the year at all.
Think about plotting the data on a graph of year against time and drawing a best fit line through the points. The closer the points are to that line, the more correlated the data and the higher the R-value.
WHAT MAKES AN R-VALUE SIGNIFICANT?
With the data we’re choosing to look at, an R-value is only significant if it is either greater than 0.805 or less than -0.805. That is a pretty high threshold, and we’ll see that for some events and placings there’s a strong trend that doesn’t quite hit this.
So what does significant mean? In this context, it means that we can say that there is an extremely strong trend in the times for this event and placement getting faster – and that it’s happening every year. A winning time that has a general downward trend but fluctuates pretty wildly year on year will have an R-value closer to zero than an event that gets faster at a slower rate, but gets faster every time.
The R-value in this case is a measure of consistency – how confident we are that this is a real trend and not just noise in the data. The significance level (0.805) is our confidence threshold in this.
Because the significance threshold is so high, we’ll also define another – a Strong threshold. We’ll set this to be when the R-value is greater than 0.5 or less than -0.5. Anything between these two values we’ll call Weak.
AN OVERVIEW
Of the 54 event/position combinations, 49 have been trending faster over the last 5 years.
| Significant Trend Faster | Strong Trend Faster | Weak Trend Faster |
| 16 | 28 | 5 |
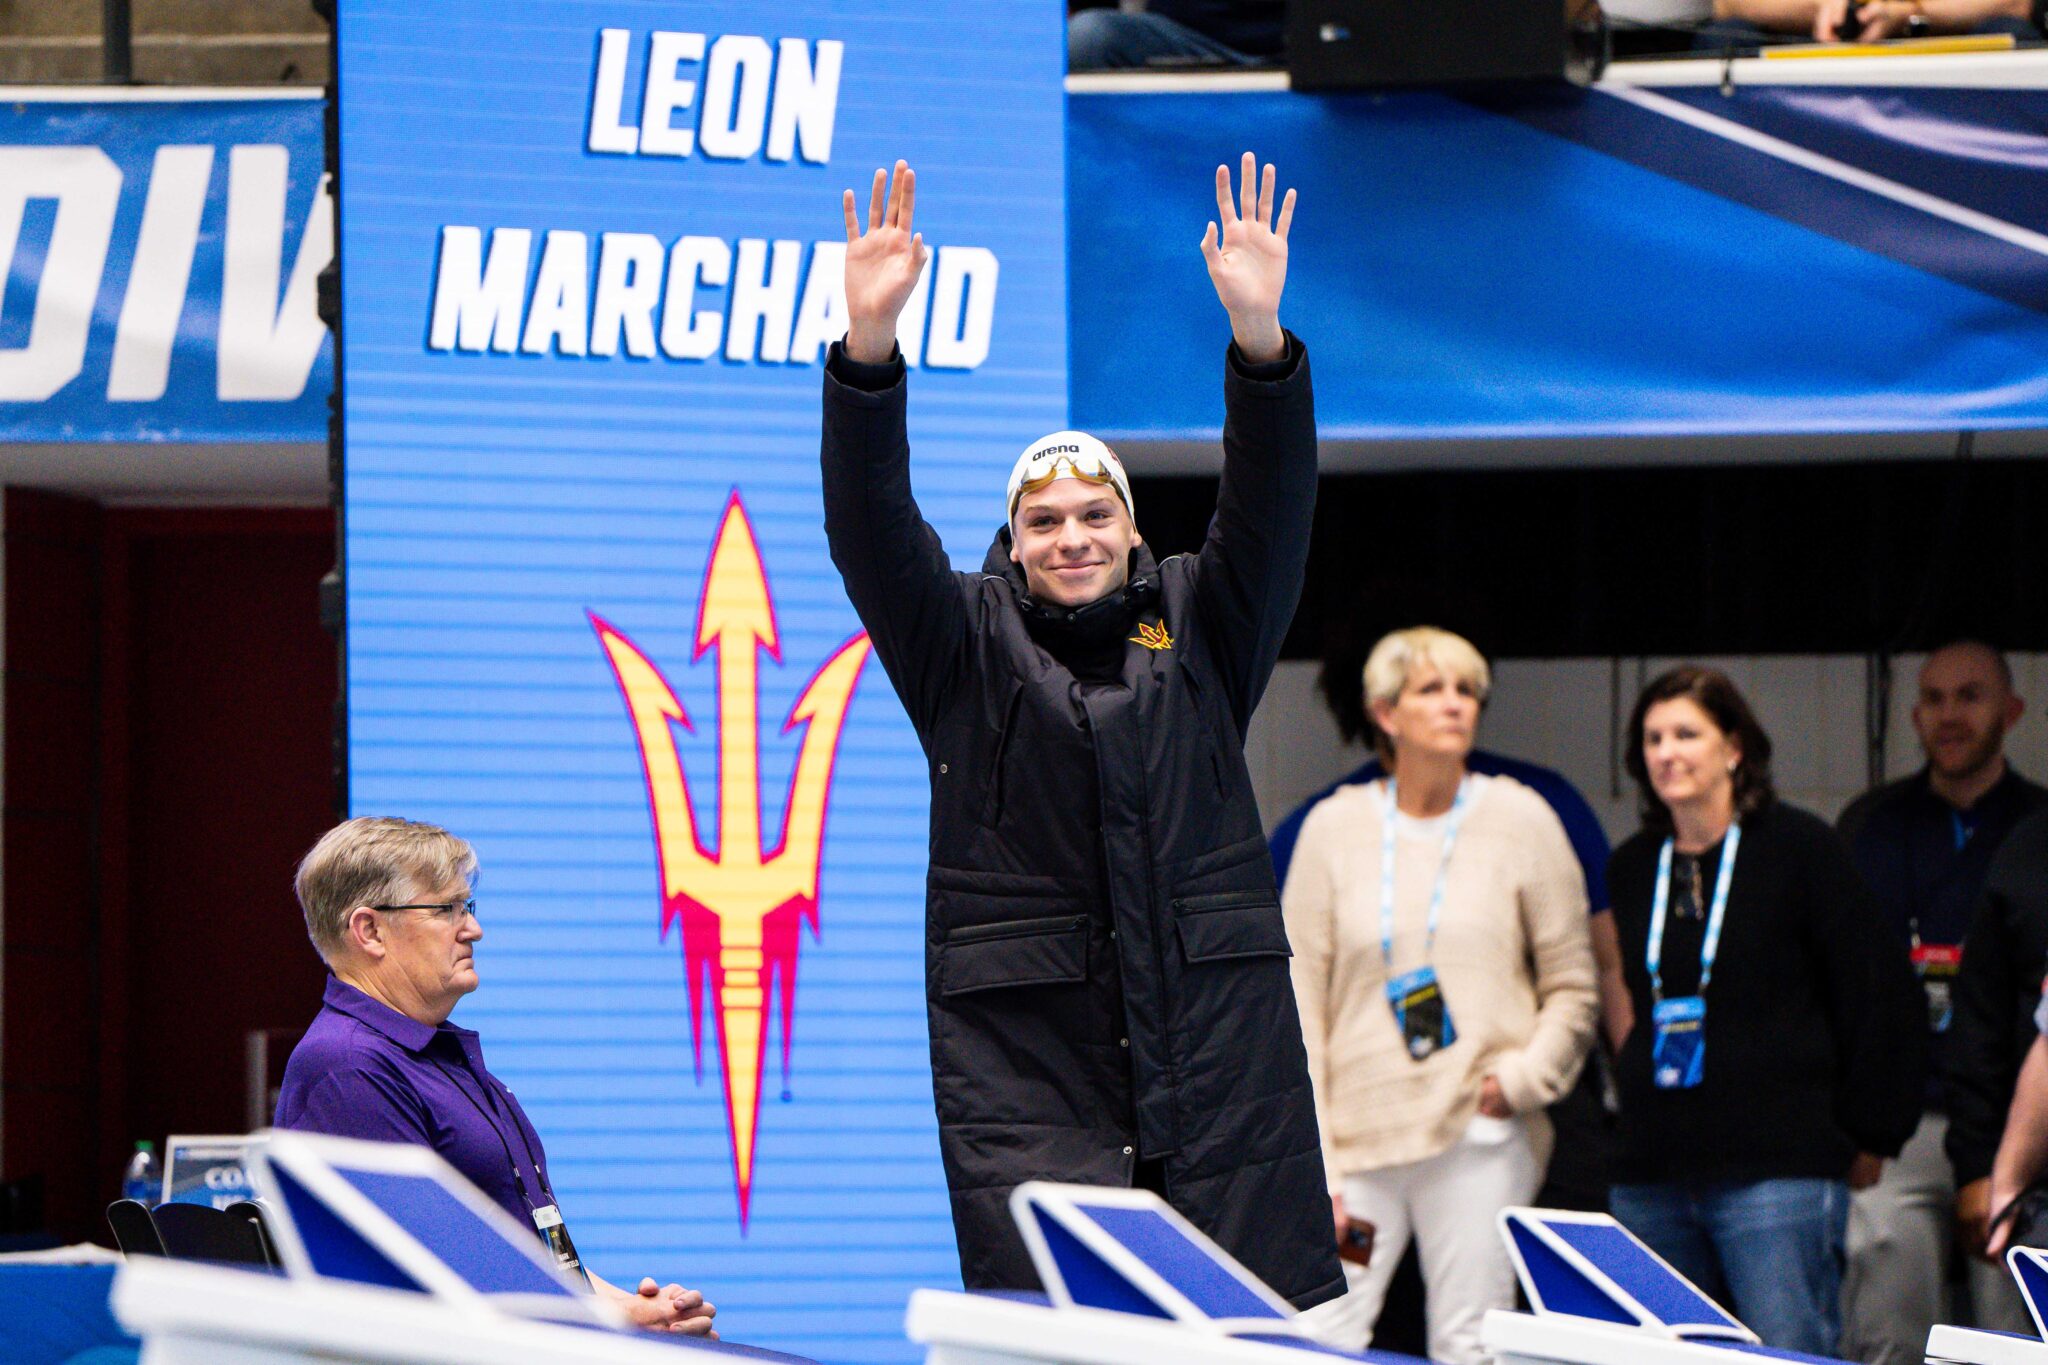
The Pac-12 has the highest percentage of strong or above trends so far, at 90.7%; 47 combinations were faster last year than in 2020 as well. As might be expected from a conference with Cal, Stanford and Arizona State, backstroke is a big strength but there’s no area that’s particularly weak. Once again distance freestyle is the area with weakest trends, but it’s a mixed bag rather than trending upwards. IM has also been impressive – and in Leon Marchand, Hugo Gonzalez and Hubert Kos, the conference has produced three of the fastest nine performers in history.
FREESTYLE
| Position | 2020 | 2021 | 2022 | 2023 | 2024 | Net Change | R-Value | Trend | |
| 50 Fr | 1 | 18.87 | 18.80 | 18.84 | 18.86 | 18.61 | -0.26 | -0.691 | Strong |
| 8 | 19.64 | 19.87 | 19.51 | 19.32 | 19.36 | -0.28 | -0.785 | Strong | |
| 16 | 19.89 | 20.23 | 19.72 | 19.55 | 19.60 | -0.30 | -0.735 | Strong | |
| 24 | 20.14 | 20.46 | 19.80 | 19.79 | 19.84 | -0.31 | -0.700 | Strong | |
| 100 Fr | 1 | 41.45 | 41.57 | 41.51 | 40.90 | 41.63 | 0.18 | -0.167 | Weak |
| 8 | 42.77 | 43.12 | 42.59 | 42.32 | 42.20 | -0.57 | -0.837 | Significant | |
| 16 | 43.48 | 43.84 | 43.15 | 42.83 | 43.14 | -0.34 | -0.694 | Strong | |
| 24 | 44.17 | 45.09 | 43.45 | 43.59 | 43.81 | -0.36 | -0.535 | Strong | |
| 200 Fr | 1 | 1:33.17 | 1:32.20 | 1:30.23 | 1:30.67 | 1:31.87 | -1.30 | -0.550 | Strong |
| 8 | 1:34.60 | 1:34.46 | 1:33.42 | 1:33.79 | 1:33.67 | -0.93 | -0.777 | Strong | |
| 16 | 1:35.09 | 1:36.45 | 1:34.97 | 1:34.65 | 1:36.16 | 1.07 | 0.068 | Weak | |
| 24 | 1:36.94 | 1:38.12 | 1:36.27 | 1:38.61 | 1:38.22 | 1.28 | 0.490 | Weak |
The Pac-12 was trending downwards in the sprint freestyles, but not quite as much as some of the other conferences. The consistent strength of Cal’s sprint corps plays a part there – Ryan Hoffer, Bjorn Seeliger and Matt Jensen have won conference titles in each of the five years here between them – and there hasn’t been the same drop in times compared to 2020. The times are still strong though: the ‘A’ final time in the 100 last year would have been 10th at NCAAs in 2021, and Seeliger and Jack Alexy were swimming at the Pro Swim Series instead. Arizona State’s revival under Bob Bowman drives some strong trends in the ‘A’ final times – they put five, three and four swimmers into those respective finals in 2024.
| Position | 2020 | 2021 | 2022 | 2023 | 2024 | Net Change | R-Value | Trend | |
| 500 Fr | 1 | 4:12.32 | 4:09.49 | 4:12.06 | 4:09.66 | 4:06.18 | -6.14 | -0.772 | Strong |
| 8 | 4:18.04 | 4:19.43 | 4:15.77 | 4:17.89 | 4:16.61 | -1.43 | -0.492 | Weak | |
| 16 | 4:20.08 | 4:25.77 | 4:20.95 | 4:23.67 | 4:20.80 | 0.71 | -0.046 | Weak | |
| 24 | 4:24.70 | 4:30.76 | 4:26.18 | 4:27.58 | 4:24.29 | -0.42 | -0.243 | Weak | |
| 1650 Fr | 1 | 14:44.60 | 14:33.69 | 14:41.22 | 14:41.65 | 14:23.01 | -21.59 | -0.639 | Strong |
| 8 | 15:03.75 | 15:08.56 | 15:03.27 | 15:09.43 | 15:05.36 | 1.61 | 0.231 | Weak | |
| 16 | 15:22.47 | 15:35.43 | 15:26.22 | 15:27.15 | 15:37.65 | 15.18 | 0.540 | Strong |
This is another conference with steadier trends in the distance freestyle, but there’s a split between the two events – the 500 slightly faster and the 1650 slightly slower. Stanford has provided two conference champions in the 500 in Grant Shoults and Preston Forst, but more recently it’s Arizona State again providing the depth to bring times down. Zalan Sarkany provided a big drop in the winning time in the 1650 last year, and had the conference continued this year it would likely be another international winning the 1650 – Lucas Henveaux has been 14:29 this year.
BACKSTROKE
| Position | 2020 | 2021 | 2022 | 2023 | 2024 | Net Change | R-Value | Trend | |
| 100 BK | 1 | 44.98 | 45.30 | 44.72 | 44.57 | 43.75 | -1.23 | -0.868 | Significant |
| 8 | 47.13 | 47.31 | 46.26 | 46.24 | 46.67 | -0.46 | -0.642 | Strong | |
| 16 | 49.24 | 48.52 | 47.41 | 47.26 | 47.45 | -1.79 | -0.883 | Significant | |
| 200 BK | 1 | 1:37.87 | 1:38.13 | 1:38.81 | 1:36.94 | 1:35.69 | -2.18 | -0.726 | Strong |
| 8 | 1:41.98 | 1:41.76 | 1:41.94 | 1:40.81 | 1:41.09 | -0.89 | -0.811 | Significant | |
| 16 | 1:46.59 | 1:45.54 | 1:45.04 | 1:43.95 | 1:43.35 | -3.24 | -0.994 | Significant |
After coming close on more than one occasion Destin Lasco finally got his NCAA record in the 200 last year, but it wasn’t Ryan Murphy whose record he took. Hubert Kos got there first, swimming a 1:35.69 at Pac-12s that stands as the fastest conference-winning time ever. There are some pretty strong trends at both distances, but it’s the 200 where the conference has been improving most, especially in the ‘B’ final time.
BREASTSTROKE
| Position | 2020 | 2021 | 2022 | 2023 | 2024 | Net Change | R-Value | Trend | |
| 100 Br | 1 | 50.85 | 51.38 | 51.30 | 51.12 | 50.89 | 0.04 | -0.120 | Weak |
| 8 | 53.59 | 53.72 | 52.79 | 52.54 | 52.41 | -1.18 | -0.923 | Significant | |
| 16 | 55.17 | 55.85 | 53.98 | 53.60 | 53.12 | -2.05 | -0.886 | Significant | |
| 200 Br | 1 | 1:49.85 | 1:48.86 | 1:50.39 | 1:47.67 | 1:48.60 | -1.25 | -0.546 | Strong |
| 8 | 1:56.25 | 1:56.77 | 1:54.60 | 1:54.52 | 1:54.30 | -1.95 | -0.856 | Significant | |
| 16 | 1:59.89 | 2:08.75 | 1:56.35 | 1:56.71 | 1:57.48 | -2.41 | -0.516 | Strong |
Reece Whitley, Liam Bell and Leon Marchand had the top step of the podium locked down in this time period, winning every breaststroke title between them, but it’s at the ‘A’ final level we see the biggest improvements. It’s Cal that’s been a big driver of this, especially in the 100. They put five men into the 20203 ‘A’ final, all of them 52.1 or better with Matt Jensen joining Whitley and Bell on the podium.
FLY
| Position | 2020 | 2021 | 2022 | 2023 | 2024 | Net Change | R-value | Trend | |
| 100 Fly | 1 | 44.85 | 45.22 | 43.90 | 44.51 | 44.32 | -0.53 | -0.555 | Strong |
| 8 | 46.61 | 47.20 | 46.29 | 45.63 | 45.91 | -0.70 | -0.766 | Strong | |
| 16 | 47.80 | 47.79 | 47.11 | 46.74 | 46.98 | -0.82 | -0.877 | Significant | |
| 200 Fly | 1 | 1:39.15 | 1:38.53 | 1:39.95 | 1:39.27 | 1:38.64 | -0.51 | -0.078 | Weak |
| 8 | 1:44.25 | 1:43.66 | 1:43.63 | 1:43.94 | 1:43.19 | -1.06 | -0.738 | Strong | |
| 16 | 1:46.51 | 1:46.50 | 1:45.68 | 1:46.36 | 1:45.80 | -0.71 | -0.618 | Strong |
The Pac-12 is the first conference we see with widespread downward trends in the 200 Fly. That goes along with some strong downward trends in the 100, and there have been a lot of top-level NCAA swimmers come out of the conference. Andrei Minakov, Ilya Kharun and Ryan Hoffer are three swimmers that have gone on to win national titles after winning at Pac-12s, and that 200 winning time is the only one across conferences to stay below 1:40 for the five years here. More impressively, that event has been won by four different swimmers in that time: Zheng Quah, Trenton Julian, Gabriel Jett and Ilya Kharun.
IM
| Position | 2020 | 2021 | 2022 | 2023 | 2024 | Net Change | R-value | Trend | |
| 200 IM | 1 | 1:41.79 | 1:41.05 | 1:39.65 | 1:37.81 | 1:38.77 | -3.02 | -0.903 | Significant |
| 8 | 1:44.68 | 1:44.91 | 1:43.13 | 1:43.16 | 1:43.88 | -0.80 | -0.638 | Strong | |
| 16 | 1:47.16 | 1:46.02 | 1:45.22 | 1:44.39 | 1:45.11 | -2.05 | -0.858 | Significant | |
| 24 | 1:49.38 | 1:47.75 | 1:46.26 | 1:46.44 | 1:47.33 | -2.05 | -0.684 | Strong | |
| 400 IM | 1 | 3:36.60 | 3:37.31 | 3:34.45 | 3:31.57 | 3:34.66 | -1.94 | -0.679 | Strong |
| 8 | 3:48.43 | 3:48.37 | 3:44.06 | 3:43.47 | 3:43.31 | -5.12 | -0.908 | Significant | |
| 16 | 3:54.71 | 4:02.40 | 3:48.90 | 3:48.98 | 3:49.08 | -5.63 | -0.661 | Strong |
Leon Marchand has swum some truly filthy times in the 400 IM, and is the top performer in history by four seconds. He’s dropped the winning time down massively in both distances, although even without him in the 200 this year there were still two men under 1:40 in Owen Mcdonald and Hubert Kos.
The ‘A’ Final time in the 400 is possibly most impressive here. For an event where NCAA qualification is fairly evenly spread and conference champs are not the quickest, it’s only a second or two off scoring. You can thank the Sun Devils for that – they put five men into last year’s final, four of them sub-3:41.
RELAYS
*There have been some big DQs at Pac-12s, and in relays these can have an outsized effect on the trends. Therefore we’ve included the times of DQ’ed teams
| Position | 2020 | 2021 | 2022 | 2023 | 2024 | Net Change | R-value | Trend | |
| 200 FR | 1 | 1:15.54 | 1:15.80 | 1:15.00 | 1:15.40 | 1:14.59 | -0.95 | -0.764 | Strong |
| 3 | 1:16.79 | 1:17.86 | 1:16.56 | 1:15.97 | 1:15.97 | -0.82 | -0.719 | Strong | |
| 400 FR | 1 | 2:46.92 | 2:48.66 | 2:45.94 | 2:45.67 | 2:44.23 | -2.69 | -0.807 | Significant |
| 3 | 2:51.05 | 2:51.35 | 2:47.17 | 2:49.06 | 2:48.54 | -2.51 | -0.658 | Strong | |
| 800 FR | 1 | 6:11.47 | 6:11.98 | 6:07.51 | 6:06.30 | 6:06.14 | -5.33 | -0.911 | Significant |
| 3 | 6:14.80 | 6:16.30 | 6:09.98 | 6:11.08 | 6:10.53 | -4.27 | -0.770 | Strong | |
| 200 MED | 1 | 1:22.16 | 1:22.74 | 1:22.74 | 1:21.69 | 1:20.55 | -1.61 | -0.741 | Strong |
| 3 | 1:24.62 | 1:24.64 | 1:23.26 | 1:23.46 | 1:23.14 | -1.48 | -0.879 | Significant | |
| 400 MED | 1 | 3:02.85 | 3:02.60 | 3:01.45 | 3:01.39 | 2:58.49 | -4.36 | -0.906 | Significant |
| 3 | 3:06.81 | 3:06.14 | 3:02.84 | 3:02.71 | 3:04.02 | -2.79 | -0.756 | Strong |
The trends for every relay indicate that times were getting faster. Arizona State’s mindset under both Bob Bowman and Herbie Behm of swimming fast all year round has led to the fastest winning times of any conference in four of the five relays, but overall it’s been a team effort. Cal, Stanford and Arizona State have each won relays (13, 3 and 9), and that competition is only a positive thing for fans of fast swimming.
IN SUMMARY
The Pac-12 had been getting quicker pretty much everywhere, and that will have a knock-on effect as the schools compete in their new conferences this year. We’ll expect every other Power conference to experience a drop in times required to score this year, but it’ll be difficult to pick out just how much is due to these transfers. Cal and Stanford may need to step up in their new home in the ACC to stay near the top, but given the level of competition the Pac-12 had they’re well placed to give it a significant boost.
I like these data driven analyses, especially since swimming is such a quantitative sport. I like the idea of using a linear model to explore potential trends over the years. However, I think only looking at 1st, 8th, 16th and 24th can easily lead to bias – these places are heavily prone to performance outliers … like Leon Marchand blowing everyone out of the water for 1st, or on the flip side, someone having a off swim and getting last in their heat by a large margin (I’ve been there).
I think it’s better to look at the whole distribution of swims, allowing us to see how the general group as a whole is trending rather than only single performers.… Read more »
Arizona is now in the Big 12, not Big 10.
Arizona has a swim team?