Courtesy: Dominique Hérailh
In virtually all sports, performance differences exist between men and women, primarily due to morphological distinctions between the sexes. This article examines several questions about how these differences vary in swimming across distances and pool sizes and even in another similar sport, track and field.
How do performance differences evolve with distance?
For this initial analysis, we focus on freestyle swimming because it includes the widest range of distances.
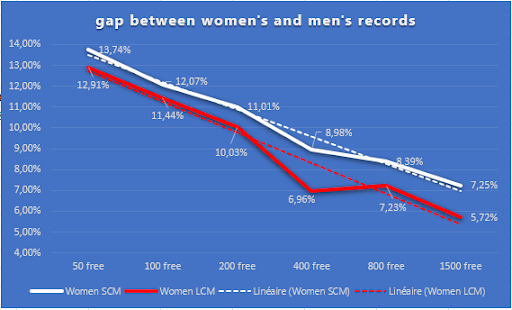
The graph shows that the performance gap between men and women narrows almost linearly as distance increases. This raises the question: will the women’s performance curve eventually intersect with the men’s, or will it level out? Generally, the gap decreases by around 1.4 percentage points each time the distance doubles. The 400-meter race is an exception to this trend. Based on the data, we would expect a gap of approximately 8.6%, yet the actual gap is under 7%. This difference can be traced back to 2009, when Federica Pellegrini set the women’s 400-meter record at 3:59.15, achieving a gap of +8.67% from Paul Biedermann‘s men’s record. Since then, three top female swimmers—Katie Ledecky, Summer McIntosh, and Ariarne Titmus—have surpassed Pellegrini’s record. Given the small remaining margin to the women’s record, it seems likely that the men’s 400-meter record will be broken next.
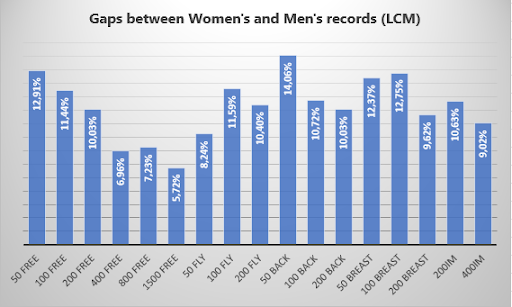
Here’s a summary of all the LCM records:
Are men’s and women’s strengths and endurance expressed differently over distance?
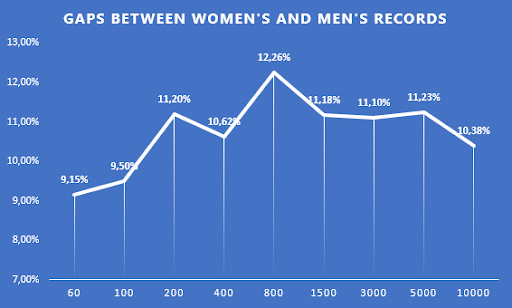
The trend suggests that men’s strength is most evident over shorter distances, while women’s endurance may yield better relative performance in longer events. If this observation holds, it should also apply to track and field, where races cover both short and long distances.
Does this trend hold in track and field?
In track and field, however, the performance gap does not follow the same pattern as in swimming. For shorter distances, the gap is narrower. For example, Usain Bolt’s 100-meter world record analysis shows that his maximum speed (12.19 m/s) was reached around the 50-meter mark, which may account for better male sprint performance up to the 400 meters. The difference is likely due to air resistance in running versus water resistance in swimming, where water’s greater density makes the hydrodynamic profile crucial at longer distances, narrowing the performance gap as distance increases.
Does the performance gap differ between LCM and SCM?
In short-course meters (SCM) races, the gap between men’s and women’s times is on average 2 percentage points larger than in long-course meters (LCM) races. The SCM curve follows a similar trend to LCM, but the additional turns and underwater sections in SCM allow men to increase their lead due to their generally higher strength off the walls. In short-course yards (SCY) races, the proportion of underwater time to total race time is even higher, widening the gap further.
Are certain swimming events more favorable to women?
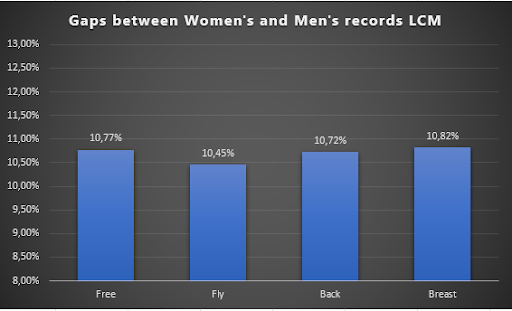
Swimming events can be compared over 50, 100, and 200 meters by calculating the average gap across these distances. The results indicate that the performance difference between event types isn’t substantial enough to conclude that any particular style of swimming is more suited to women than another.
In summary, men’s advantage in strength tends to show over short distances, while women’s endurance appears advantageous over longer distances. The extent of these differences, however, varies by sport and by course type (LCM vs. SCM vs. SCY).
If you are solely comparing the World Record, Ledecky is an outlier and makes the longer distances look narrower than they are for the common athlete.
Until the late 70s, women were only 10 years behind the men’s world record in the 1500. In fact, Murray Rose won the 1500 in the 1956 Olympics in 17:59, and by 1967, Debbie Meyer had the World Record at 17:50 and would take almost 20 seconds off of that a year later. Kim Linehan set the WR in 1979 (which would remain until Janet Evans came along in 1987) at 16:04.49, a hundredth faster than Mike Burton had the WR in 1969. By the time Evans rebroke her own World Record by eight seconds to go 15:52 in 1988, the gap was just over 15 years, and even with as good as Ledecky is, her record from 2018 is… Read more »
Women 200 Back = 🔥🔥🔥
Men 200 Back = 💀💀💀
My opinions = 🪦🪦🪦
The gap in running starts closing at the longer distances. It’s 8.9% in the half marathon and 7.5% for the marathon. The 100k is 7.3%. With all the records being recent. The question with track is what’s going on between 60 and 5000m after that I think you get a continually shrinking gap. But the no clear trend in track for the 5000 and below which is roughly the same completion times as freestyle events is intriguing.
I’d be interested in open water differences but without official records that I could find you’d likely have to do an event by event comparison. I get that water conditions affect performance more than weather will affect running, but still would be nice… Read more »
Here are the men’s gold medal-winning times from the 1972 Olympics that are slower than current women’s WRs:
200m free: 1:52.78 (Mark Spitz) is slower than 1:52.23 (Ariarne Titmus, 2024)
400m free: 4:00.27 (Brad Cooper) is slower than 3:55.38 (Ariarne Titmus,2023)
1500m free: 15:52.58 (Mike Burton) is slower than 15:20.48 (Katie Ledecky, 2018)
100m breast: 1:04.94 (N. Taguchi) is slower than 1:04.13 (Lilly King, 2017)
200m breast: 2:21.55 (John Hencken) is slower than 2:17.55 (E. Chiunova, 2023)
200m IM: 2:07.17 (Gunnar Larsson) is slower than 2:06.12 (K. Hosszu, 2015)
400 IM: 4:31.98 (Gunnar Larsson) is slower than 4:24.38 (Summer McIntosh, 2024)
Can we just pause for a second to appreciate how otherworldly Ledecky’s 1500 WR swim was? 15:20.48 is a mind-blowingly fast time.
Janet Evans went a 15:52.10 1500 in March 1988, less than 16 years after Mike Burton’s 15:52.58 from the 1972 Olympics. She was 16. You can do similar comparisons with Mary T’s 200 fly.
MaryT was just over 5 seconds slower than Spitz’s 200 fly time from Munich just 9 years later. She was unbelievable (and still only 16).
Just bow to greatness.
yet as a percentage of the mens WR, it is further away than Titmus 400FR. Shows how fast all of them are.
400 free having a smaller gap than expected makes sense, the women’s event has been pushed so much ever since the rise of Ledecky while the men’s event has been stagnant for so long
I’d expect the men’s 400 free WR to go under 3.40 in 2025 (with Maertens, Winnington, Short and others pushing each other). But Titmus and McIntosh may take the women’s WR down to 3.54 or lower.
imo a 3:40 men’s is about 3:59 women, maybe down to 3:58.5. Which is pretty crazy to think about, that means McIntosh and Titmus PBs are around in the 3:37-3:37.5 range or maybe even lower
Imo it’s more like 3:56
I think you underestimate how insane 3:40 is for a man. Thorpe was god when he did it 25 years ago, Sun Yang still crushing everyone with it 12 years ago. And given that the best of the best even today are still just going right off that barrier, maybe it makes more sense to think that’s just somewhat near the human limit than the event has stagnated.
Some of the graphs are somewhat misleading because the horizontal axis is not set to equal distance intervals. If you plot the gap between the records as a function of distance, you can see that it tends to level out at around 6% or so at longer distances, and below the 400 the gap increases linearly.
As I indicated in the text, the trend is linear when the distance is doubled at each graduation of the x-axis.
Yes, the straight-line curve is actually logarithmic rather than truly linear. As the distance doubles, the gap goes down by a little over 1%.
Exactly.