We asked our swimming data partner TritonWear to help us with a deeper insight into performances and what makes elite swimmers fast and where they can improve. This is their TritonWear analysis.
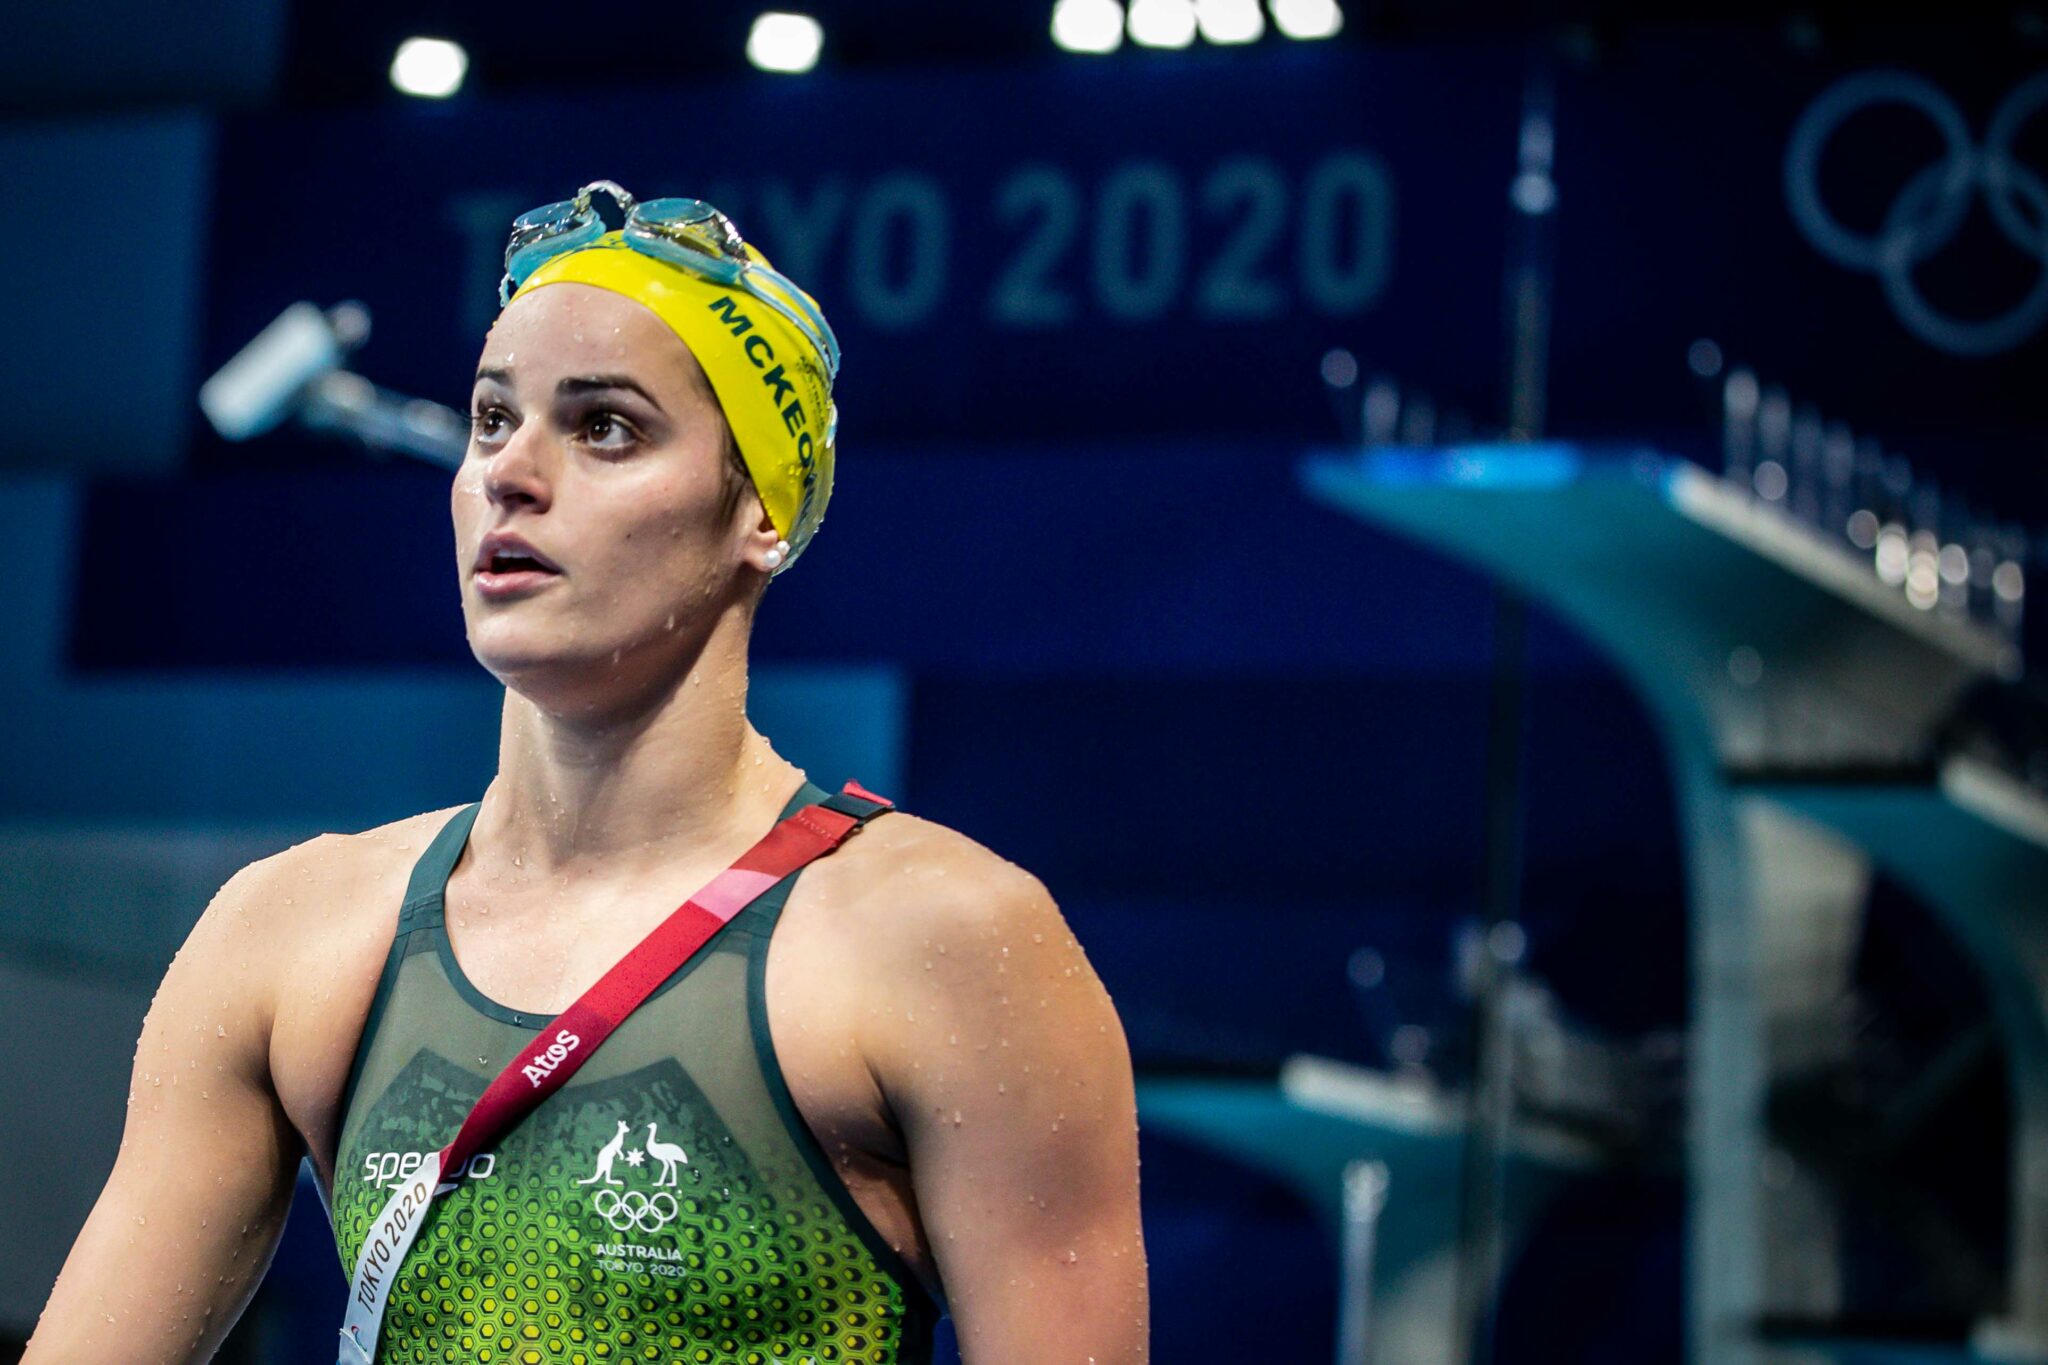
Kaylee McKeown powered through to her first gold on Tuesday with an incredible race of 57.47 after an all-out back-to-back battle on the last 50 with Kylie Masse.
Although Masse was in the lead from the start and held it all the way to the 75m mark, McKeown swooped in and stole the win, with Masse taking silver (57.72) and Reagan Smith the bronze (58.05). McKeown’s time was only two hundreds of a second away from her world record race at the Australian Trials just three weeks ago.
Did McKeown switch gears during the last meters of the star-studded race, or was there a performance gap she took advantage of? Were there any subtle changes between the podium swimmers’ performances in Tokyo compared to their Trials swims? Let’s explore the data to find out.

For this analysis, we’re using the same TritonWear data 30+ national federations trust when training elite athletes, bringing you all the insights into faster swimming.
While analyzing McKeown’s performance in relation to her world record showing from the Australian Trials, we can see that she was even faster underwater in Tokyo with a Speed Underwater avg. of 2.42 vs 2.32 (m/s).
What’s more interesting, is her increase in Speed Underwater came without cutting corners on her average Time Underwater ( 5.25s). So although she was faster, she didn’t surface earlier (a tradeoff we often see in the data).
Looking further into McKeown’s Speed Underwater by lap, the data reveals that the most significant impact came after her turn, where her Speed Underwater was 2.2, up from 1.97 (m/s) at Trials.
As for the overwater phase, McKeown is swimming close to her World Record but is more efficient on her first 50. Her Stroke Count avg was better in Tokyo, taking fewer strokes on the first lap ( 34 strokes vs 35) and the same number in the second (37).
The decrease in Stroke Count results from her increase in Distance per Stroke, DPS (2.14m vs 2.07m), showing she held water better in Tokyo on the first part of the race. However, her increase in DPS also influenced her average Stroke Rate, SR ( 48.26 from 49.01 cyc/min). So although she was holding more water, she was not spinning her arms as fast.
When comparing the second 50m of both races, we can further see that Kaylee McKewon had a lower DPS (2.07m vs 2.13m) and a slightly lower SR. Here’s a breakdown of her Stoke Rate Average (Start- Mid-End).
100 BK Tokyo: 50.48, 47.97, 46.56 (cyc/min)
100 BK Trials: 51.38 , 48.9 , 46.56 (cyc/min)
Masse had a lower Speed Underwater (2.59 from 2.8 m/s) and ended up not breaking out as far as she did off her start in the Canadian Trials. Interestingly, although she was slower on her Transition Time in Tokyo ( 1.72s vs 1.4s), she exploded off the wall, clocking a faster Underwater Speed (2.37 vs 2.0 m/s).
*Transition Time is last stroke pull time + Turn time + Pushoff time. It is measured from the last stroke entry (before the turn) to the next split push end (when feet leave the wall).
As for the overwater swimming, she increased her SR from 49.22 to 50.43 (cyc/min) without sacrificing DPS. Furthermore, the relationship between these two metrics granted Kylie the fastest Overwater Speed (1.7 m/s) among the top three winners in Tokyo.
Moving on, Kylie’s Stroke Count was consistent in the first 50m (35 strokes in both meets) but she took two extra strokes in the second (totalling 40 in Tokyo). Even with a naked eye, it was pretty evident Masse struggled to move water past the 75m and as she approached the wall. Her Stroke Rate drop from Mid to End shows clear signs of fatigue in the last seconds of this race.
Here’s a breakdown of her Stoke Rate (Start- Mid-End) for the second lap.
Second Lap Tokyo: 50.58 cyc/min, 48.67 cyc/min, 44.7 cyc/min
Second Lap Trials: 48.62 cyc/min, 45.84 cyc/min, 44.7 cyc/min
Regan Smith’s performance between Tokyo and the US Trials is almost identical; however, the small changes she did make were enough for her to swim 0.30s faster.
One noticeable change is that she decreased her SR from 54.76 to 53.07 (cyc/min)on the first lap but did the opposite for the second one, where she increased it from 50.37 to 52.25 (cyc/min) without trading off her DPS for it.
Furthermore, mastering a better relationship between the two metrics meant she was charging towards the finish with a higher Overwater Speed (1.62 from 1.55 m/s).
Key Takeaways
The most significant difference between Kylie Masse’s performance and Kaylee McKeown’s lies in their Stroke Rate to Distance Per Stroke tradeoff.
In detail, Masse had a higher average Stroke Rate, powering her way through the water. While McKeown had a longer Distance Per Stroke, carrying more water with every stroke.
However, the highest Stroke Rate among the three winners was Smith’s, who is all gas no breaks with an incredible average SR 52.56 cyc/min. Unfortunately, despite the high SR her DPS was not up to par with her other two opponents. In fact, Smith was holding the lowest average among all three, with a DPS of 1.92m (vs 2.10m and 2.08m for McKeown and Masse repectively).
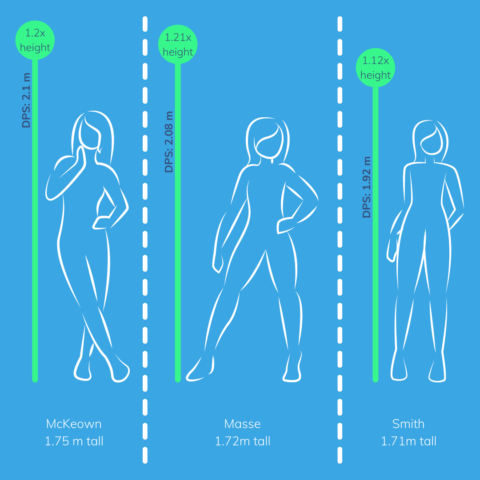
FUN FACT: Masse wins at DPS! She pulls 1.21x times her body length on every stroke, McKeown pulls 1.20x hers, while Smith lags at only 1.13x her body length per stroke.
To conclude, McKeown did not switch gears towards the end of her race. What happened instead was she held her speed and water better. One of the most substantial components of her swimming is her ability to hold her SR from Start to Mid to End better than the rest of the athletes in this race. So, although she didn’t have the highest SR among the top 3, she also didn’t fluctuate as much and maintained her strokes’ length with her killer DPS.
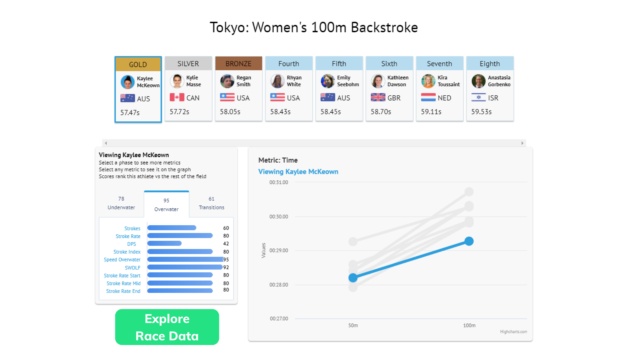
Draw Your own Conclusions
Head over to TritonWear’s epic Race Analysis page
to explore every detail of each swimmer’s race data.
We understand that not all coaches and swimmers are data-heads. Analyzing data requires a lot of time and effort that, frankly, most just don’t have. At TritonWear, we strive to make data quick, easy and fun to use so you can focus on swimming and leave the number-crunching to us.
With a glance at the Triton Score, you’ll know instantly how well you trained and even get personalized feedback highlighting exactly where you’re excelling and what you need to improve on to swim faster.
Athletes: Get started with as little as $20/month and receive a free unit (included with your membership).
Coaches: Create highly personalized winning strategies for individual swimmers and the team as a whole with data-driven insights. 30+ national federations trust us to help them train these elite athletes; you can too. * Volume prices apply.
About TritonWear
TritonWear is a sleek wearable device and app that helps you train well consistently, so you can swim faster. It captures and relays 30+ data points in real-time to any mobile device on deck. Triton Score analyzes your data and provides you with actionable insights highlighting exactly where you’re excelling and what you need to improve on to swim faster.

Love this analysis. It seems that the Aussies this week like Titmus and Zac S-C and McKeown have not slowed down as much as their opponents towards the end of the race. Our TV feed also has metres per second for each swimmer also.
Some of these differences seem very extreme, e.g. Masse’s speed off the turn going from 2.0 m/s at trials to 2.37 m/s is an 18.5% increase!
My guess is that these numbers are very sensitive to measurement error. As an example, let’s say that McKeown can cover 12m underwater off the turn in 5 seconds (avg speed 2.4 m/s).
If you allow +- 0.5m error for measuring the break-out distance and +- 0.2 seconds for measuring the break-out time, the speed you calculate can be anywhere from 2.60 m/s to 2.21 m/s. And unless you have multiple camera angles of footage for each individual swimmer, those error allowances are likely on the small side.