2025 U.S. NATIONAL CHAMPIONSHIPS
- Tuesday, June 3 – Saturday, June 7, 2025
- Indianapolis, Indiana
- Indiana University Natatorium
- LCM (50 meters)
- World Championship Selection Criteria
- Meet Central
- Pre-scratch psych sheets
- Live Results
Whilst the women’s side will see the majority of the stars entered in the 2025 U.S. National Championships, in the breaststroke Lydia Jacoby’s absence and Lilly King’s focus on the shorter events will leave breaststroke spots open this year, both for the Worlds team and for the final.
Fewer returning swimmers means more jeopardy over who makes the final, and depending on who those swimmers are more jeopardy over who makes the top two. If a Worlds or Olympic qualifier from the previous National Championships does not return there is a bigger prize up for grabs than just a spot in the final.
So how will the 2025 final compare to events at previous Champs? The best way to make that comparison is to put a number on it.
The Methodology
To compare the continuity of Trials finals, we have devised a Finals Continuity Score. Each swimmer in a Trials final receives a score based on their finishing position in that event. At the next Trials, we add up the scores of the returning swimmers and divide by the maximum possible score (all swimmers returning).
Example:
2021 Women’s 200 IM
- Alex Walsh- 8 points
- Kate Douglass- 7 points
- Madisyn Cox – 6 points
- Torri Huske – 5 points
- Meghan Small – 4 points
- Melanie Margalis- 3 points
- Beata Nelson- 2 points
- Emma Barksdale – 1 point
2022 Women’s 200 IM
- Alex Walsh – 8 returning points
- Leah Hayes – NEW
- Beata Nelson – 2 returning points
- Mackenzie Looze – NEW
- Isabelle Odgers – NEW
- Sara Stotler – NEW
- Abby Hay – NEW
- Teagan O’Dell – NEW
Total returning points: 10
Maximum possible returning points: 36
Final Continuity Score – 0.278 (10/36)
Note that this methodology does not look at why a swimmer does not return – someone missing the final in 9th is treated the same way as a swimmer who did not enter the event, such as Kate Douglass in the example above.
So, how does each event stack up? We’ve collated the data from all U.S. Trials finals since 2013, which gives us Continuity Scores for a decade’s worth of Trials (2014-2024).
NB. The stroke 50s have three data points, the men’s 800 free (and women’s 1500 free) has six and all other events have eight. Only consecutive Trials are counted to determine scores, so non-Olympic events only feature here in the second Trials of the pair between Olympic years.
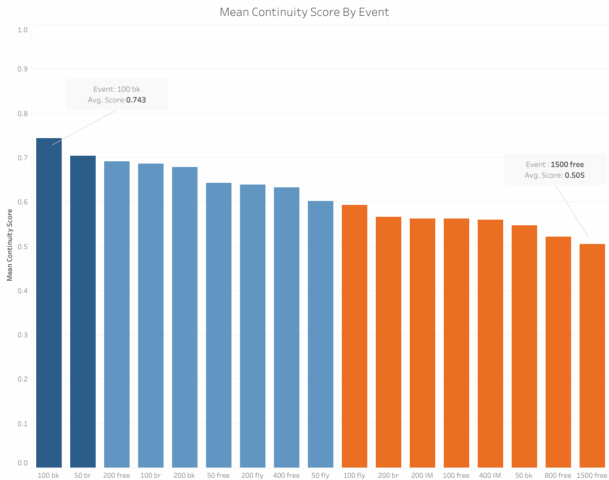
The Extremes
Surprisingly given the success the US women have had over the last decade, it’s the two distance freestyle events that have been the least consistent. However, the very nature of the events themselves – a big training block and less chance of peaking multiple times a year – lends itself to a high turnover.
The 50 backstroke is also in the bottom three, far below the other two backstroke events which are both in the top 5.
- 1500 free – 0.505
- 800 free – 0.521
- 50 back – 0.546
Whilst there was something of a theme for the bottom three, the top three are a mix of both distances and disciplines. The depth of US Women’s 100 backstroke is the envy of the world – there are multiple international-final-caliber swimmers every year who do not make the team – and it is comfortably on top here.
- 100 back – 0.743
- 50 breast – 0.703
- 200 free – 0.691
| Event | Average Continuity Score 2014-24 | World Medals | Olympic Medals | Total Medals |
| 100 back | 0.743 | 6 (1 gold, 2 silver, 3 bronze) | 4 (2 silver, 2 bronze) | 10 (1 gold,4 silver, 5 bronze) |
| 50 breast | 0.703 | 4 (2 gold, 1 silver, 1 bronze) | – | 4 (2 gold, 1 silver, 1 bronze) |
| 200 free | 0.691 | 3 (1 gold, 1 silver, 1 bronze) | 1 (1 gold) | 4 (3 gold, 1 silver, 1 bronze) |
| 100 breast | 0.686 | 4 (2 gold, 1 silver, 1 bronze) | 4 (2 gold, 2 bronze) | 8 (4 gold, 3 silver, 1 bronze) |
| 200 back | 0.679 | 6 (1 gold, 3 silver, 2 bronze) | 2 (1 gold, 1 silver) | 8 (2 gold, 4 silver, 2 bronze) |
| 50 free | 0.642 | 3 (1 gold, 2 bronze) | 1 (1 silver) | 4 (1 gold, 1 silver, 2 bronze) |
| 200 fly | 0.639 | 5 (3 silver, 2 bronze) | 3 (2 silver, 1 bronze) | 8 (5 silver, 3 bronze) |
| 400 free | 0.632 | 8 (3 gold, 3 silver, 2 bronze) | 4 (1 gold, 1 silver, 2 bronze) | 12 (4 gold, 4 silver, 4 bronze) |
| 50 fly | 0.602 | 1 (1 bronze) | – | 1 (1 bronze) |
| 100 fly | 0.592 | 3 (1 gold, 2 bronze) | 3 (1 gold, 1 silver, 1 bronze) | 6 (2 gold, 3 silver, 1 bronze) |
| 200 breast | 0.566 | 5 (1 gold, 3 silver, 1 bronze) | 3 (1 gold, 1silver, 1 bronze) | 8 (2 gold, 4 silver, 2 bronze) |
| 100 free | 0.563 | 2 (1 gold, 1 bronze) | 2 (1 gold, 1 silver) | 4 (2 gold, 1 silver, 1 bronze) |
| 200 IM | 0.563 | 5 (2 gold, 1 silver, 2 bronze) | 4 (2 silver, 2 bronze) | 9 (2 gold, 3 silver, 4 bronze) |
| 400 IM | 0.559 | 4 (3 silver, 1 bronze) | 5 (3 silver, 2 bronze) | 9 (6 silver, 3 bronze) |
| 50 back | 0.546 | 3 (1 gold, 2 silver) | – | 3 (1 gold, 2 silver) |
| 800 free | 0.521 | 6 (5 gold, 1 bronze) | 4 (3 gold, 1 bronze) | 10 (8 gold, 2 bronze) |
| 1500 free | 0.505 | 5 (4 gold, 1 silver) | 3 (2 gold, 1 silver) | 8 (6 gold, 2 silver) |
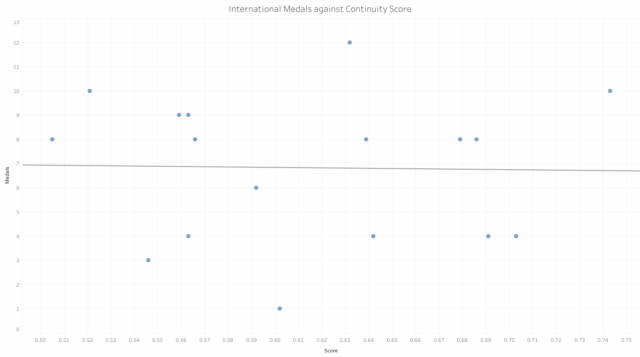
The connection between Continuity Score and international medals is not strong for the women. The regression between the two has an R-Squared value of 0.0005, where the scale is between zero and 1 – 1 indicating a perfect model. The Continuity score does not appear to be correlated at all with international success for the women.
That’s a big difference compared to the men, for whom it was a strong predictor. Potentially the women’s events are more top-heavy. That is certainly the case for distance freestyle, where the overwhelming majority of the international medals have come from Katie Ledecky.
Year by Year
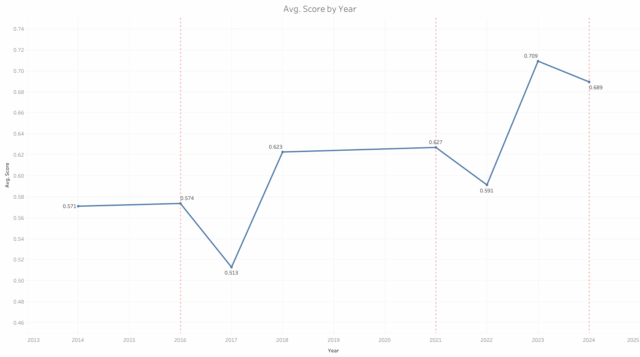
The last two National Championships immediately after an Olympic year have seen marked drops in continuity. Retirements and years off are the most obvious reasons, but the finalists in those years seem to make it stick at subsequent National Championships: there is a bump of over 0.1 in the next year both times.
The overall continuity has been trending upwards over the last decade. There may be a plateau point now – 0.7 is a high average score to maintain – and 2024 was the first Olympic Trials in this period to see a drop from the previous year.
Stroke Breakdown
Here’s what the year-by-year breakdown per event looks like, grouped by stroke.
Sprint Freestyle
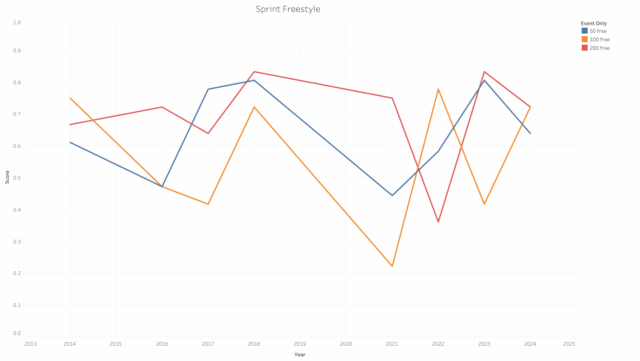
The 100 and 200 freestyles almost appear negatively correlated since 2021, which culminated in them having the exact same score last year. There was something of a changing of the guard in 2022 in the 200, with Claire Weinstein, Erin Gemmell and Anna Peplowski now having established themselves as perennial finalists.
Distance Freestyle
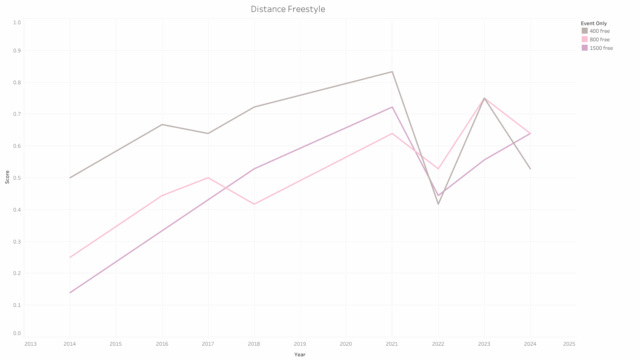
All three distance freestyle events have moved reasonably well in tandem over the last decade. The 400 was the highest scoring by a distance, but the gap has narrowed since 2022. Katie Ledecky won the event in all of the three most recent National Championships, but three different women have finished second – and only one of those has been in the final the year after.
Backstroke
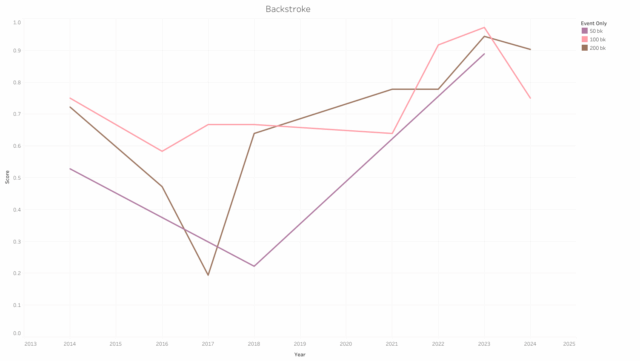
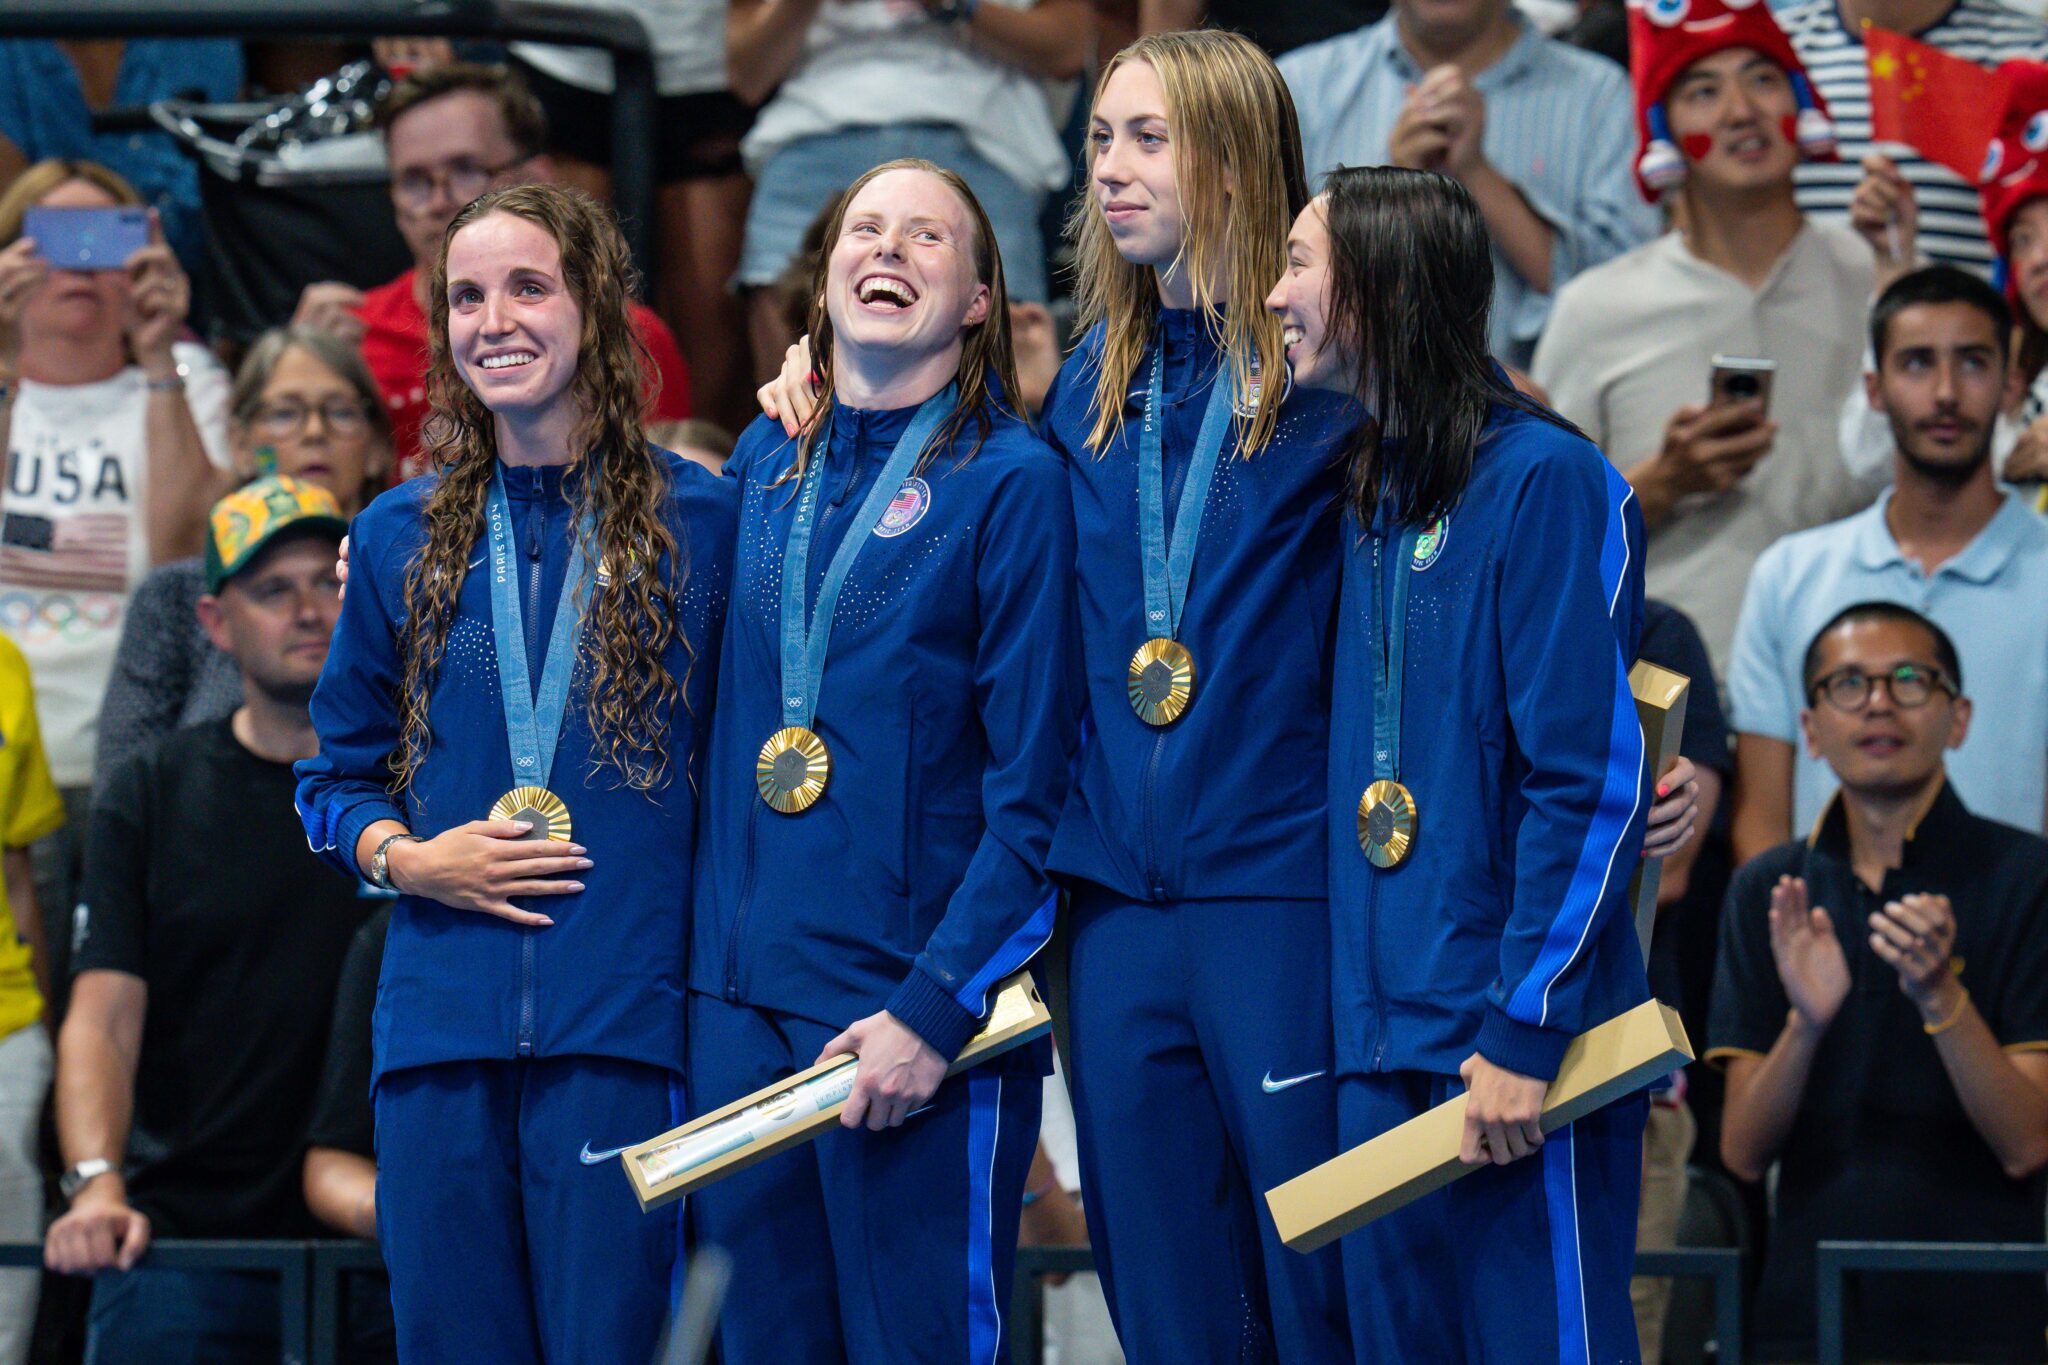
Backstroke was on the rise in the last Olympic cycle with 2023 marking a high point – all three distances had a Continuity Score of 0.889 or greater. There were four backstroke medals in Fukuoka that summer, a trio of silvers for Regan Smith and a bronze for Katherine Berkoff in the 100.
Breaststroke
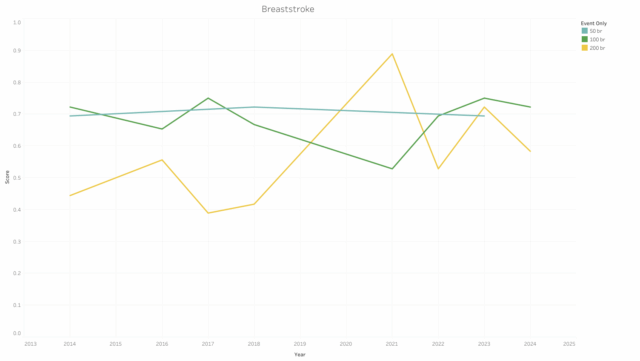
As the distance gets longer the swings between continuity and change get larger in breaststroke. Lilly King has dominated the shorter distances for the US women over the last few years, but does not have the same iron grip on the 200. That event experienced a big jump in 2021, with six of the 2018 final returning, but then only returned three swimmers in 2022.
Fly
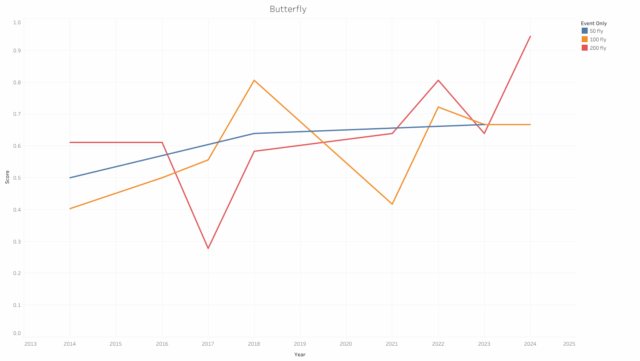
The 200 fly had the highest score of any event last year (0.944) and was one of only six events not to experience a dip. The 100 was another of those, despite the loss of Kate Douglass (2nd in 2023) and Alex Shackell (4th in 2023) scratching the final.
IM
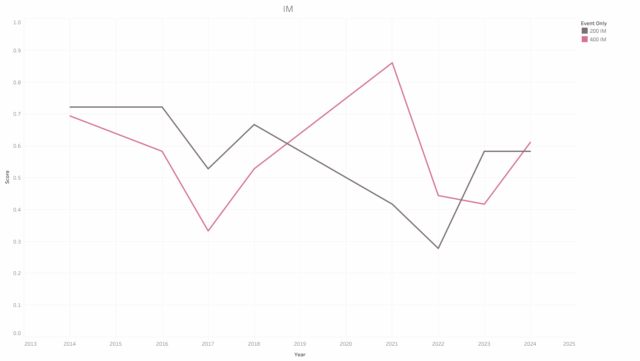
The 400 IM saw the biggest dip in score after Tokyo, with a score of just 0.444 in 2022 after a high of 0.861 in 2021. Both distances have been on the upswing since 2022, but are still on the lower end overall. That may well change this year, as five of last year’s final in the 200 and six of last year’s final in the 400 are seeded in the top 8 for each event.
I wonder if there’s a connection between the number of swimmers advancing from B to A finals year-to-year and medals. This could shed some light on whether swimmers with steady advancement or explosive newbies have a greater impact on medal count.
Wouldn’t it be better to weigh all the spots in the final equally