
Courtesy of Steven Gambino
With Rio in the rear view mirror and World Championships on the horizon, we can once again speculate who will be the dominating forces of the swimming world. Much like the way the Lebron/Jordan debate comes up every time the NBA finals roll around, the names of Phelps and Ledecky echo through natatoria across the country whenever USA Swimming steps up on the blocks for major international competition. Unlike debating the G.O.A.T. NBA player however, the discussions surrounding swimming greatness usually have an objective advantage for determining who is the superior athlete: who got to the wall faster?
Swimmers know all too well that the clock can be objective and deterministic, sometimes painfully so, but that does not mean it is comprehensive in its evaluation of performance. Though effective for a simple direct comparison within a given event (exceptions for the tech suits perhaps), for less direct comparisons like measuring the extent of a swimmer’s sportwide dominance, the significance of performances across different strokes and distances, or how the rest of the world stacks up against the U.S., swim-times themselves provide an incomplete analysis. Use of statistics can add nuance to such analysis. It’s important to remember though, that stats come with stories and the lens through which we examine these numbers have a big influence on the stories we tell and the champions we crown.
The Dominance Narrative
Katie Ledecky stole the show at the 2016 summer Olympics, winning 3 individual gold medals in the 800, 400, and 200 Freestyles, with an additional gold and silver anchoring the 4×100 and 4×200 Freestyle Relays.
On the one hand, this story is exciting; Ledecky has made distance swimming cool again and obviously, both qualitatively and quantitatively, her accomplishments are incredible and have forced us to reevaluate what we previously thought possible. On the other hand, this narrative overshadows other performances that were arguably just as impressive, if not more so. Let’s allow the stats to tell a different story.
Surprisingly, Ledecky isn’t actually responsible for the single most dominating swim of the games. Yes, she performed unbelievably in multiple events, but in comparing any single race, her numbers don’t stack up to the dominance of Adam Peaty’s 100m Breaststroke. This has briefly been examined on Swim Swam before, but there, dominance was defined as a percent difference of time only in comparison to the swimmer finishing in 2nd place. Looking more closely at the average margin of victory over the entire field of Olympic finalists (places 2nd-8th), his performance stands out even further.
Breaking his own World Record, and very nearly becoming the first breaststroker to break 57 seconds, Peaty beat his opponents in the final heat by an average of about 3.7%. Sure, to the untrained eye, Ledecky’s 800 FR win by nine or so body lengths may look more impressive visually, but it actually only accounts for about a 3.3% average margin of victory over the other finalists (the use of the word “only” here is certainly regrettable – Ledecky’s win is still 2016’s second most dominating swim on the biggest stage in the sport). The difference of .4% between Peaty’s and Ledecky’s sensational margins of victory may seem somewhat insignificant at first, but once you consider that Katinka Hosszu ranks just behind Ledecky with average margins of victory of 2.9% and 3.0% in the 400 IM and 200 IM, respectively, 3.7% becomes that much more impressive.
Furthermore, looking back across the recent history of the event, Cameron van der Burgh dominated by an average of roughly 2.2% in London 2012; Kosuke Kitajima, widely regarded as one of the greatest breaststrokers of all time, won only by averages of 1.6% in Beijing 2008 and 2.0% in Athens 2004; and Domenico Fioravanti won by an average of about 1.5% in Sydney 2000. Considering that in 2000 and 2004 there were no finalists even under a minute and Peaty is now knocking on the door of a 56 with a comparably enormous average margin of victory, his performance could arguably be the most dominant single race of the century in all of swimming. Peaty’s swim not only dominates all previous Olympic finals in his given event, but also stands atop a Rio Olympics that included a particularly impressive set of dominating performances.
In contrast, the highest margin of dominance on a given performance in London 2012 was Missy Franklin’s victory in the 200 Back at an average of about 2.9%, followed closely by Sun Yang’s 400 Free at 2.8%, both of which fall short of the performances of Peaty, Ledecky, and Hosszu in Rio. Rio was full of star-powered swims and Adam Peaty led the charge. Even in Phelps’ 200 IM in Beijing, his most dominating performance of his Olympic career, he only comes in at about 3.65% over the field, still about .07% behind Peaty’s win.
Hosszu also deserves a huge amount of credit here. She had never won an Olympic medal coming into these games, and now, according to Rowdy Gaines, is inarguably “the most versatile swimmer in the world,” leaving Rio with 3 golds, a silver, and two of the top 5 most dominating swims of the summer. Her dominance is even more impressive when you add this fact to her story: Hosszu comes from Hungary, a country that only had 4 other finalists in individual events, which isn’t even one-sixth of the 31 U.S. finalists.
Lily King deserves an honorable mention with the 6th most dominant performance (and the most swagger) in the 100 BR (~2.7%). Phelps’ 200 IM, the 7th most dominant swim of the games, is worth a mention as well since it was his fourth straight Olympic win in that event (I didn’t factor consecutive victories into my calculations – we’d really need to create a separate statistic just for Phelps).
A full list of the top 10 most dominant swims from Rio:
| Rank | Name | Event | Avg % Dominance vs. Finalists |
| 1 | Adam Peaty | M 100 BR | 3.72 |
| 2 | Katie Ledecky | W 800 FR | 3.27 |
| 3 | Katie Ledecky | W 400 FR | 3.20 |
| 4 | Katinka Hosszu | W 200 IM | 3.02 |
| 5 | Katinka Hosszu | W 400 IM | 2.91 |
| 6 | Lily King | W 100 BR | 2.71 |
| 7 | Michael Phelps | M 200 IM | 2.46 |
| 8 | Kosuke Kitajima | M 400 IM | 2.40 |
| 9 | Sarah Sjostrom | W 100 FL | 2.39 |
| 10 | Joseph Schooling | M 100 FL | 2.01 |
Ranking the Rankings
About this time last year we were hearing about the doubts in the USA team. They were younger and less experienced than past teams, and in many cases their times at Trials just didn’t stack up to the international competition. Of course, once the dust had settled and bubbles had cleared, no doubt remained; USA came out on top. The more curious questions are: How can/should we determine the actual ranks of countries at large-scale international competitions? How do the other countries stack up to the USA?
My inspiration for investigating the answers to these questions was Kevin Hallman’s piece in the Superhero issue of Swim Swam, where in previewing the World Championship meet, he scored all of the final heats of individual swims from the past four Long Course World Championships with an 8-7-6-5-4-3-2-1 scoring system (8 points for 1st, 7 for 2nd, etc). This is an interesting and unconventional scoring system. To me, it begs the question of how we decide championship meet scoring systems, to begin with and how much of an impact such systems can have on results. If we use Hallman’s scoring method as a starting place, here are the results for the Rio Olympics (individual events only):
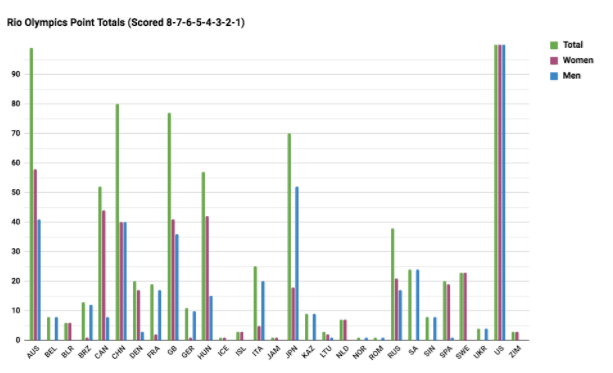
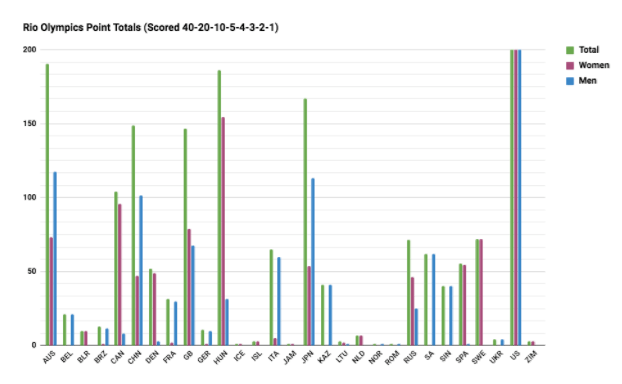
All 29 countries that finaled in Rio are pictured above. The USA scores extend — literally — off the chart. With this scoring system, Australia stands out as a clear second. This may seem surprising; their performance was disappointing relative to expectation, particularly on the women’s side. After all, they won fewer medals than in the previous Olympic Games in London. Speaking of medals, it is common to use medal count as a metric for a country’s performance.
So what happens if we look only at medal count (1-1-1) in Rio? As you can see, Australia would place fifth:
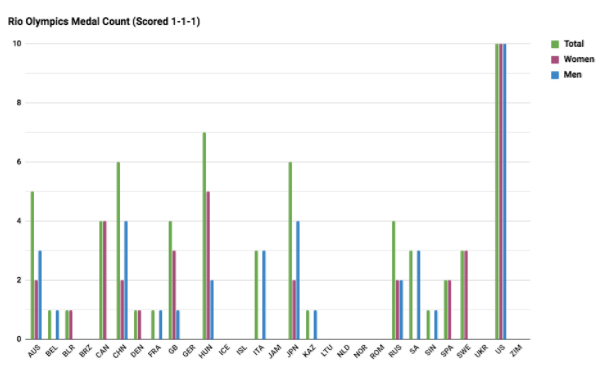
From the perspective of medal count, Australia is outperformed by Hungary, Japan, and China; not surprising considering the performances of Hosszu, Hagino and others. This second chart tells a very different and much less favorable story for the Aussies. In my opinion, though, a singular focus on medal count is a limited, narrow ranking system primarily because it doesn’t differentiate between gold, silver and bronze. 8-7-6-5-4-3-2-1 makes only a small distinction between gold and silver, while 1-1-1 makes no distinction, but does place a higher priority on distinguishing between those who medaled and those who did not.
Perhaps a system of 8-4-2 would be more appropriate; a silver medal is worth half of a gold, and a bronze is worth half of a silver:
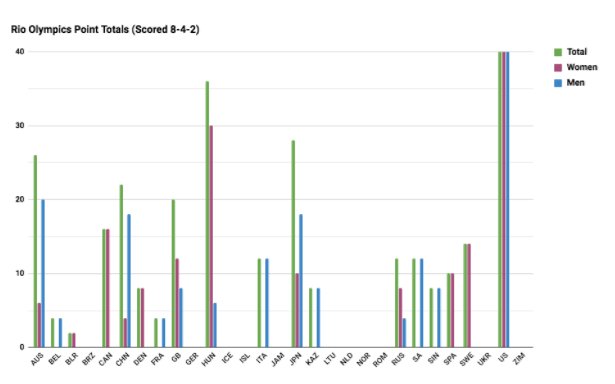
Here, Hungary still takes 2nd, and the majority of the ranks don’t change too much relative to medal count, though Australia does bump China for fourth. My assumption is the Russians wouldn’t appreciate this method, as they took a big drop from 6th to 10th place. Ultimately it can be argued that this system is flawed as well since it doesn’t take into account any of the other finalists. Considering the degree of difficulty and prestige of the Olympic Games, finalising in itself is a substantial feat and surely worthy of some points. Furthermore, without valuing places 4-8, these ranks make no distinction between lower ranking, non-medaling countries like Netherlands and Zimbabwe for example, and this is far from ideal.
With the goal of giving some value to all final positions, while still making the winners stand out amongst the pack, I decided to examine the other extreme (in the sense of a gold medal’s relative value to the other places) of the system proposed by Hallman and try scoring the meet 28-7-6-5-4-3-2-1. Here the value of the gold medal is equal to the cumulative value of 2nd through 8th.
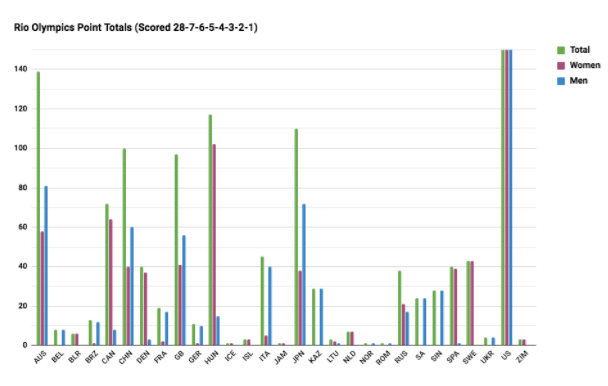
Australia is back in 2nd and Russia drops even further to twelfth. Personally, that seems a little low, but this system is also arguably unfairly beneficial for countries like Singapore, whose single finalist won a gold medal (Joseph Schooling, 100 Butterfly). Here, that single win is worth as much as four silver medals. So maybe this doesn’t fit perfectly either.
Per the suggestion of a friend, I also investigated the system used by Mario Kart (truncated after 8th place), and scored the meet by a 15-12-10-8-7-6-5-4 system. This seems like a better balance of placing more value on each of the medals, while still making each finalist worth something, but the overall rankings do not actually change much from Hallman’s system. Denmark is really the only country that benefits substantially here, moving from 12th to 9th in comparison to Hallman’s 8-7-6-5-4-3-2-1 system.
If you’re curious, here are the full ranks based on each system (Note: In ranking all of these systems, I let the “dominance factor”, i.e., the percent each performer finished behind the winner, break ties. It turns out that factoring this in has a relatively small effect on the outcomes otherwise.):
| 1-1-1 Rank | 8-4-2 Rank | 28-7-6-5-4-3-2-1 Rank | 8-7-6-5-4-3-2-1 Rank | 15-12-10-8-7-6-5-4 Rank | |||||
| 1 | USA | 1 | USA | 1 | USA | 1 | USA | 1 | USA |
| 2 | HUN | 2 | HUN | 2 | AUS | 2 | AUS | 2 | AUS |
| 3 | JPN | 3 | JPN | 3 | HUN | 3 | CHN | 3 | CHN |
| 4 | CHN | 4 | AUS | 4 | JPN | 4 | GB | 4 | GB |
| 5 | AUS | 5 | CHN | 5 | CHN | 5 | JPN | 5 | JPN |
| 6 | RUS | 6 | GB | 6 | GB | 6 | HUN | 6 | HUN |
| 7 | CAN | 7 | CAN | 7 | CAN | 7 | CAN | 7 | CAN |
| 8 | GB | 8 | SWE | 8 | ITA | 8 | RUS | 8 | RUS |
| 9 | SWE | 9 | ITA | 9 | SWE | 9 | ITA | 9 | DEN |
| 10 | ITA | 10 | RUS | 10 | DEN | 10 | SA | 10 | ITA |
| 11 | SA | 11 | SA | 11 | SPA | 11 | SWE | 11 | SWE |
| 12 | SPA | 12 | SPA | 12 | RUS | 12 | DEN | 12 | SA |
| 13 | DEN | 13 | DEN | 13 | KAZ | 13 | SPA | 13 | FRA |
| 13 | KAZ | 13 | KAZ | 14 | SIN | 14 | FRA | 14 | SPA |
| 13 | SIN | 13 | SIN | 15 | SA | 15 | BRZ | 15 | BRZ |
| 16 | FRA | 16 | FRA | 16 | FRA | 16 | GER | 16 | GER |
| 17 | BLR | 17 | BEL | 17 | BRZ | 17 | KAZ | 17 | KAZ |
| 18 | BEL | 18 | BLR | 18 | GER | 18 | SIN | 18 | BEL |
| 19 | BRZ | 19 | BRZ | 19 | BEL | 19 | BEL | 19 | SIN |
| 19 | GER | 19 | GER | 20 | NLD | 20 | NLD | 20 | NLD |
| 19 | ICE | 19 | ICE | 21 | BLR | 21 | BLR | 21 | BLR |
| 19 | ISL | 19 | ISL | 22 | UKR | 22 | UKR | 22 | LTU |
| 19 | JAM | 19 | JAM | 23 | ZIM | 23 | ZIM | 23 | UKR |
| 19 | LTU | 19 | LTU | 24 | ISL | 24 | ISL | 24 | ZIM |
| 19 | NLD | 19 | NLD | 25 | LTU | 25 | LTU | 25 | ISL |
| 19 | NOR | 19 | NOR | 26 | ICE | 26 | ICE | 26 | ICE |
| 19 | ROM | 19 | ROM | 27 | ROM | 27 | ROM | 27 | NOR |
| 19 | UKR | 19 | UKR | 28 | NOR | 28 | NOR | 28 | JAM |
| 19 | ZIM | 19 | ZIM | 29 | JAM | 29 | JAM | 29 | ROM |
In analyzing all the systems side by side, there are a couple of interesting notes: Russia jumps around quite a bit, ranking as high as 6th in the medal count, but as low as 12th in the 28-7-6-5-4-3-2-1 system. Also, Canada is 7th, always. Always 7th. That consistency was definitely unexpected, but it serves as an effective way to partition the ranks into tiers. The United States ranks first in every system. With the exception of Great Britain and Russia in the medal count, the countries within the top 6 rankings stay there across all tested systems. Also ranks 8-16 are pretty consistently comprised of countries like Italy, Russia, Sweden, Denmark, France and Spain, with only a little variance. This would give us the following partitions:
| Tier 1 | Tier 2 | Tier 3 | Tier 4 |
| USA | AUS | CAN | DEN |
| CHN | FRA | ||
| GB | ITA | ||
| HUN | RUS | ||
| JPN | SPA | ||
| SWE |
So which system is the best? In problems looking for an optimal result, it is often useful to look to mathematics as a guide. The problem is, there really is no “right” way to do this. There is a theorem in mathematics, or more specifically in social choice theory, called Arrow’s Impossibility Theorem. In this application, this theorem basically states that since there are more than two competing countries, it is impossible to create a “perfect,” consistent ranking system without sacrificing one of the following “pretty reasonable” conditions:
- The rank shouldn’t be determined by a single event.
- If in every event, Country A places higher than Country B, Country A can’t finish behind Country B in the overall ranks.
- For example, if the U.S. swimmers placed higher than the French swimmers in every event, France couldn’t rank higher overall than the U.S.
- Consider countries A,B,C. Assume A is ranked higher than B overall. For every event where A is finishing before B, swapping the results between B and C (as long as A is still before B) cannot change the fact that A is ranked higher than B overall.
- In other words, if the place order of two countries, relative to each other, remains unchanged, their final rank, relative to each other, must also remain unchanged.
- For example, if in the 200 FR, Sarah Sjorstrom (SWE) won instead of Katie Ledecky (USA) and Katie instead took 2nd, the rank of all other countries should not be affected. This change should not, for example, suddenly cause Sweden to rank higher than Italy.
All of the systems above break the third condition. (Using the example above, if you swap Sarah and Katie’s place in the 200 FR, then Sweden usurps Italy using the Mario Kart system ranks.) No matter how these meets are scored, there will be inconsistencies and issues.
Where does that leave us then? With stories. Because at the end of the day, with no perfectly objective system, you have the ability and power to decide what you value most in creating a ranking system. Purely by place? Rank 8-7-6-5-4-3-2-1. Winning is super important, but the other places matter too? Rank 28-7-6-5-4-3-2-1. Medal Count is the end-all-be-all? Rank 1-1-1.
Personally, I’d like a system that can balance all of these things. My proposition is to use 40-20-10-5-4-3-2-1. Here, 2nd is worth half of first, 3rd is worth half of 2nd, and in all cases medaling is worth at least twice more than not medaling, while yielding some value to all final positions. For Rio, we can observe that the ranking of each country in this system falls about the middle of the range of ranks across the other systems. Taking the average place of each country across all six previously mentioned systems, the 40-20-10-5-4-3-2-1 system ranks each country closest, on average, to their average place.
| Country | 40-20-10-5-4-3-2-1 Rank | Average Rank |
| AUS | 2 | 2.83 |
| BEL | 17 | 18.00 |
| BLR | 20 | 19.67 |
| BRZ | 18 | 17.17 |
| CAN | 7 | 7.00 |
| CHN | 5 | 4.17 |
| DEN | 13 | 11.67 |
| FRA | 16 | 15.17 |
| GB | 6 | 5.67 |
| GER | 19 | 17.83 |
| HUN | 3 | 3.67 |
| ICE | 26 | 23.67 |
| ISL | 24 | 22.50 |
| ITA | 10 | 9.33 |
| JAM | 29 | 25.50 |
| JPN | 4 | 4.00 |
| KAZ | 14 | 14.50 |
| LTU | 25 | 22.50 |
| NLD | 21 | 19.83 |
| NOR | 28 | 24.83 |
| ROM | 27 | 24.67 |
| RUS | 9 | 8.83 |
| SA | 11 | 11.67 |
| SIN | 15 | 15.33 |
| SPA | 12 | 12.33 |
| SWE | 8 | 9.33 |
| UKR | 22 | 21.17 |
| USA | 1 | 1.00 |
| ZIM | 23 | 21.83 |
Average Difference between Country’s Rank in Given System to Average Rank Across all Systems:
| 1-1-1 | 8-4-2 | 28-7-6-5-4-3-2-1 | 8-7-6-5-4-3-2-1 | 15-12-10-8-7-6-5-4 | 40-20-10-5-4-3-2-1 |
| 2.05 | 1.93 | 1.3 | 1.47 | 1.62 | 1.06 |
In analyzing the scoring for the London Olympics as well, this proves to be even more true, further confirming the potential effectiveness of this system. Using this system, some countries fall more towards the outside of their range, but in general this system proves to be a good balance, so for now, I propose we stick with it:
Here we again have Australia in second, but it’s by a much smaller margin, as Hungary is only about 4 points behind. In my opinion, this is more fitting. We also have Russia in 9th place, the exact middle of the range across the other five systems. Canada is again 7th, so it keeps consistency there. Although I have an obvious bias, this systems seems to fit best with the narrative I’ll personally remember from the Rio games. Maybe this satisfies you as well, or maybe not. Maybe such a balance is important to you, or maybe not. That is the beauty and the problem of statistics.
Numbers never lie, but the statistics we use are ultimately a reflection of our subjective values and the stories we want to share. Can a system that creates balance and compromise across multiple subjective values work or are we more polarized on our opinions of what ranking systems should focus on? Either way, I’m looking forward to seeing how this summer’s elite swimmers continue to write their stories at World Championships.
Steve – what are your thoughts on the Meena Method?
https://www.meenamethod.com/posts-list/themeenamethod
I think you mean Kosuke Hagino, not Kosuke Kitajima for the Rio 400 IM (under: “top 10 most dominant swims from Rio”)! 😉
Yes! Good catch, thanks.
40-20-10-5-4-3-2-1 gives too much emphasis on gold medals, which allows one swimmer (Hosszu) to drastically impact a country’s ranking. How about 28-14-7-5-4-3-2-1? Also, the Mario Kart scoring system works well. And relays should count double points.
I think that’s a fair criticism of this system. Personally, I tend to favor gold medals being heavily weighted, but of course, that’s why any system is somewhat subjective.
In Rio, 28-14-7-5-4-3-2-1 gives a nearly identical ranking to 40-20-10-5-4-3-2-1. China and Great Britain swap. Russia and Sweden swap. Everything else stays the same, so Hungary benefits equally.
In London, the top 20 countries rank identically between the two systems.