
Courtesy: Steve Gambino
Scoring a swim meet is pretty clear-cut, right? Simply assign points to an athlete’s team based on their finish place in an event and tally up the points after all the events – the team with the highest total points wins. Of course, the specific point award for each place will vary from meet to meet depending on its size, format, and league, but this general method is utilized in hundreds of meets per year at all levels from summer league to high school or college swimming. This same method is even the basis of the scoring system adopted by the sport’s first professional league, the International Swimming League (ISL). It may seem like the only, or at least most obvious, way to do it. After all, framing a sport made up of a series of individual, independent, and mostly asynchronous performances into a team sport requires some sort of aggregation. Assigning points and summing is arguably the simplest, clearest, and most natural method. But, it’s not the only one.
So, how could we do it differently?
Malcolm Gladwell proposed an interesting alternative method on a podcast last July 1. Though the discussion was specifically focused on running and cross country, his suggestion could be generalized to swimming as well: instead of aggregating points (which are assigned somewhat arbitrarily/subjectively anyway), aggregate times.
The motivation here is that a points-based scoring system makes the outcome heavily weighted by the top performers, with those at the bottom of the pack contributing much less significantly, if at all, to the overall team performance. After analyzing the ISL’s base scoring system (2019)² and their amended “Jackpot” System (2020-present)³, it is apparent that the primary driver of what wins the team matchup is simply what team has the most top athletes winning each event individually.
Depending on your perspective and your goals, this may be good. For the ISL specifically, which may wish to market itself off the star power of the top athletes, this may be ideal for growing its brand. But as Gladwell notes, “Right now, if I’m the 20th best runner at my high school, what’s my motivation for joining the cross-country team?”¹ So, for some (perhaps high school swimming or similar), alternatives may be worth considering.
Of course, these changes don’t come without tradeoffs too. While, as Gladwell states, “your 20th runner matters as much as your first runner,”¹ under this system, it also means your 20th runner (or swimmer) has a lot more pressure to perform well if the team is relying upon them to win. This may or may not be beneficial depending on your perspective.
As always, determining what scoring system is best comes down to a value assessment. Each sport, level, and league will all have different values and different goals, and thus need to determine what system works best for them. But the ISL is a professional league with elite athletes, and more importantly for now, with publicly available and easily accessible results that can be analyzed and experimented with. So…
What if Malcolm Gladwell scored the ISL?
Season 3 Results
The table below details the results of each match from the ISL’s third and most recent season (2021), including the teams’ original point totals, their aggregate time (Gladwell), and their ranking based on the time (G Rank). For each match, the teams are listed in order of their original ranking. Increased finish places are highlighted in green and decreased finish places are highlighted in red/orange.
Note: The aggregate times are listed in seconds throughout the article for sake of simplifying the math. If this system were to be implemented, it would likely be best to display them in an H:MM:SS format. For example, Energy Standard’s Match 1 time of 8344.51 seconds would be displayed in competition/results as 2:19:04.51 for 2 hours, 19 minutes, and 4.51 seconds.
| Table 1: Season 3 Results by ISL (Original) and Gladwell Scoring (in seconds) | ||||||||
| Regular Season | ||||||||
| MATCH 1 | Original | Gladwell | G Rank | MATCH 7 | Original | Gladwell | G Rank | |
| Energy Standard | 511.5 | 8344.51 | 2 | Cali Condors | 581.0 | 8336.65 | 2 | |
| Toronto Titans | 496.5 | 8325.54 | 1 | Toronto Titans | 529.5 | 8309.24 | 1 | |
| Aqua Centurions | 442.5 | 8363.40 | 3 | Iron | 362.5 | 8402.19 | 3 | |
| DC Trident | 311.5 | 8364.88 | 4 | NY Breakers | 293.0 | 8405.63 | 4 | |
| MATCH 2 | Original | Gladwell | G Rank | MATCH 8 | Original | Gladwell | G Rank | |
| Cali Condors | 707.0 | 8386.52 | 1 | Energy Standard | 508.0 | 8316.32 | 1 | |
| LA Current | 402.5 | 8403.93 | 2 | London Roar | 490.5 | 8321.16 | 2 | |
| Tokyo Frog Kings | 382.5 | 8412.39 | 3 | LA Current | 386.5 | 8372.08 | 4 | |
| NY Breakers | 269.0 | 8457.26 | 4 | Tokyo Frog Kings | 381.0 | 8328.51 | 3 | |
| MATCH 3 | Original | Gladwell | G Rank | MATCH 9 | Original | Gladwell | G Rank | |
| Energy Standard | 640.5 | 8334.47 | 1 | Energy Standard | 568.0 | 8332.68 | 1 | |
| London Roar | 436.5 | 8373.50 | 2 | London Roar | 457.5 | 8375.62 | 4 | |
| Iron | 405.5 | 8393.78 | 3 | Toronto Titans | 380.5 | 8359.54 | 3 | |
| NY Breakers | 278.5 | 8428.08 | 4 | DC Trident | 357.0 | 8359.53 | 2 | |
| MATCH 4 | Original | Gladwell | G Rank | MATCH 10 | Original | Gladwell | G Rank | |
| Cali Condors | 594.0 | 8311.60 | 2 | Aqua Centurions | 563.0 | 8324.27 | 2 | |
| LA Current | 444.5 | 8295.74 | 1 | Iron | 529.0 | 8326.94 | 3 | |
| Aqua Centurions | 375.5 | 8340.68 | 4 | Tokyo Frog Kings | 397.0 | 8312.98 | 1 | |
| DC Trident | 359.0 | 8314.46 | 3 | NY Breakers | 272.0 | 8387.65 | 4 | |
| MATCH 5 | Original | Gladwell | G Rank | MATCH 11 | Original | Gladwell | G Rank | |
| Toronto Titans | 533.0 | 8277.58 | 1 | DC Trident | 506.0 | 8287.17 | 1 | |
| LA Current | 453.5 | 8299.27 | 3 | Iron | 497.0 | 8347.41 | 4 | |
| DC Trident | 418.5 | 8289.86 | 2 | NY Breakers | 388.5 | 8340.04 | 2 | |
| Iron | 374.0 | 8378.70 | 4 | Tokyo Frog Kings | 385.5 | 8344.40 | 3 | |
| MATCH 6 | Original | Gladwell | G Rank | |||||
| London Roar | 529.5 | 8325.63 | 3 | |||||
| Cali Condors | 478.5 | 8322.03 | 2 | |||||
| Aqua Centurions | 379.5 | 8344.61 | 4 | |||||
| Tokyo Frog Kings | 376.5 | 8316.56 | 1 | |||||
| Playoffs | ||||||||
| MATCH 12 | Original | Gladwell | G Rank | MATCH 15 | Original | Gladwell | G Rank | |
| Cali Condors | 534.5 | 8345.67 | 2 | London Roar | 534.5 | 8304.34 | 2 | |
| Energy Standard | 522.0 | 8329.85 | 1 | Cali Condors | 474.5 | 8300.01 | 1 | |
| DC Trident | 359.5 | 8385.69 | 3 | LA Current | 438.5 | 8349.40 | 3 | |
| Iron | 340.0 | 8446.66 | 4 | Iron | 324.5 | 8388.27 | 4 | |
| MATCH 13 | Original | Gladwell | G Rank | MATCH 16 | Original | Gladwell | G Rank | |
| LA Current | 506.0 | 8353.69 | 1 | Energy Standard | 539.5 | 8322.63 | 2 | |
| London Roar | 494.5 | 8362.21 | 2 | London Roar | 498.5 | 8313.07 | 1 | |
| Toronto Titans | 398.5 | 8363.09 | 3 | LA Current | 394.5 | 8382.16 | 3 | |
| Aqua Centurions | 357.0 | 8470.55 | 4 | DC Trident | 284.5 | 8385.58 | 4 | |
| MATCH 14 | Original | Gladwell | G Rank | MATCH 17 | Original | Gladwell | G Rank | |
| Energy Standard | 583.0 | 8298.11 | 1 | Cali Condors | 532.5 | 8320.49 | 1 | |
| Toronto Titans | 407.0 | 8320.52 | 2 | Iron | 446.0 | 8394.54 | 3 | |
| Aqua Centurions | 390.0 | 8360.66 | 4 | Aqua Centurions | 444.5 | 8409.00 | 4 | |
| DC Trident | 383.0 | 8320.61 | 3 | Toronto Titans | 337.0 | 8353.93 | 2 | |
| Championship | ||||||||
| MATCH 18 | Original | Gladwell | G Rank | |||||
| Energy Standard | 534.0 | 8249.02 | 1 | |||||
| Cali Condors | 522.0 | 8267.77 | 2 | |||||
| London Roar | 393.5 | 8307.27 | 3 | |||||
| LA Current | 305.5 | 8396.04 | 4 | |||||
The first thing to note is that 14 out of the 18 matches would be impacted by Gladwell’s scoring system. This may be expected or even seem obvious; but you may recall that the ISL’s Jackpot System (the additional tweak to the standard system that was introduced in Season 2) had nearly no impact on the final results of the meets⁴. So, the fact that Gladwell’s scoring system altered the majority of matches in Season 3 is, in fact, significant.
The teams’ final scores are also much closer to one another under Gladwell’s system than the original. Throughout all of Season 3, the original scores ranged from a low of 279 points (NY Breakers in Match 2) to a maximum of 707 points (Cali Condors in Match 2) – a range of 428 points. Gladwell’s scores, on the other hand, ranged from a “minimum” of 8470.55 seconds (Aqua Centurions in Match 13) to a “maximum” of 8249.02 seconds (Energy Standard in Match 18) – a range of only 221.53 seconds (less than 4 minutes). Despite scores on the magnitude of 8000s, the range in Gladwell’s scoring system is actually smaller than the range of points from the original system. That means that these matches would be significantly closer under an aggregate time system. The chart below compares the range of scores of each system across every meet from Season 3.

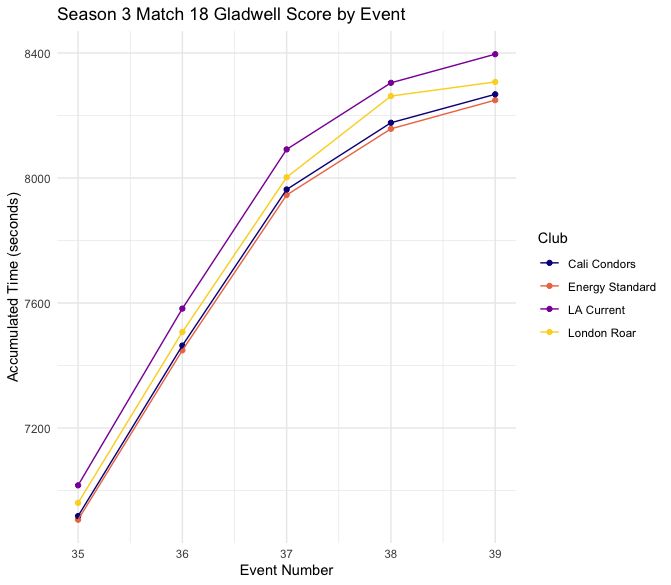
The 1st place and 4th place teams differ by an average of about 223 points, but only a difference of about 77 seconds. This trend becomes even more apparent upon a closer look at an individual match. Let’s consider the Season 3 Championship (Match 18). This is one of the few matches where the final team ranking is identical between systems; however, their story throughout the match is very different.

The chart above shows the accumulated score of each team in both systems after each event of the match. The ISL’s original scores are colored in orange. Notice that as we scan left to right (i.e., as the match progresses) the scores of each of the four clubs spread out into four (mostly) distinct and clearly separated lines. Energy Standard and Cali Condors remain somewhat close, but LA Current and London Roar fall very distinctly below them as early as event 10, and continue to remain far behind throughout the remainder of the match. In contrast, using Gladwell’s scores (colored in dark blue), the four teams are barely distinguishable. This means that where the original system creates a large separation of teams, clearly distinguishing the final results relatively early in the match, Gladwell’s system makes the match quantitatively closer all the way until the very end. Under the original scoring system, the LA Current were basically out of contention for a win by the end of event 20. More specifically, the Cali Condors had scored 309 points by event 25 – more than the LA Current’s final total of 305.5. Instead, using aggregate time, the Current don’t exceed the leading time of 8249.02 until event 38 (the second to last event). So, it appears each team can contend down to the wire.
This fundamentally changes the nature of the meet and, in theory, could add substantially more drama! Every race and every individual swim matters. Does Katie Ledecky win by a pool length in the 400 free? Top swimmers hitting jaw-dropping times can make a huge difference toward keeping the total down. But also, does Sara Franceschi drop a personal best in her 200 IM to bring LA Current a few seconds closer to the mix? As the 8th place finisher in the 200 IM in Match 18, Sara touched the wall more than 3 seconds behind the 7th place performer. Sara’s 1-point contribution from this race was basically a given, but also essentially trivial toward the overall team score. But now, the performances of competitors like Sara can be greatly impactful too. As Gladwell puts it, “under this system – the 20th person – we are as passionately interested in how well they run, as we are in the first.”¹
Prioritizing Time
Time is emphasized as a significant component under Gladwell’s system as well. The ISL has tried to avoid this for much of its tenure, often not even displaying finish times during the broadcasts. Instead, they’ve opted to prioritize the “who-beats-who” matchup nature of races. Whether this is for better or worse depends on your perspective, but there is no denying that time is a fundamental aspect (or the fundamental metric) of the sport at every elite (and sub-elite) competition. For swimmers and swim fans who are intimately familiar with times, I would be curious to see if they find Gladwell’s system more engaging as well.
The flip side of this is that it devalues races where the winner out-touches their competitor by only a few hundredths. If Katie Ledecky wins by a pool length, her contribution toward her team is substantial under Gladwell’s system. However, when Tom Shields won against Caeleb Dressel by two-tenths in the men’s 100 fly from the Season 3 championship, it was an exciting upset (and 6-point swing) in the LA Current’s favor; but this becomes much more trivial (and possibly less exciting) when aggregating times. Now, a single 6-point swing wasn’t exactly going to change the overall outcome of the match either, but using Gladwell’s system instead could certainly have shifted the excitement away from a close head-to-head matchup like this. Whether or not this tradeoff is worth it, depends on the league’s perspective and priorities.
Predictability – Does Quantitative Closeness Correspond with Competitive Closeness?
While the relative closeness of the teams under Gladwell’s system may make the meets seem more dramatic in theory, it may not actually play out that way in practice. The smaller quantitative and proportional difference between teams does theoretically provide an opportunity for a trailing team to have a big swim that allows them to overtake a competitor. Likewise, one DQ, mistake, or bad performance from a leading team could cost them that lead. However, big swings may not be particularly likely in many races, especially the shorter sprint-focused events. In general, there isn’t necessarily a high degree of variance in times between athletes’ performances. So, opportunities to exchange leads may not be much greater under this system. In other words, swimmers tend to perform relatively consistently, which means overall, the outcomes might be relatively predictable under this system. Does the proportional “closeness” of the scores actually correspond with a “competitive closeness?”
This can be true under either system though. I’m certainly not the first to make the suggestion that swimming’s difficulty in becoming an exciting and dramatic spectator, team sport is in large part a function of its overall predictability. To say whether one scoring system is more or less predictable than the other though, would require a more extensive analysis on the predictability of swimming more generally. For now, though, we’ll leave this as a hypothesis.
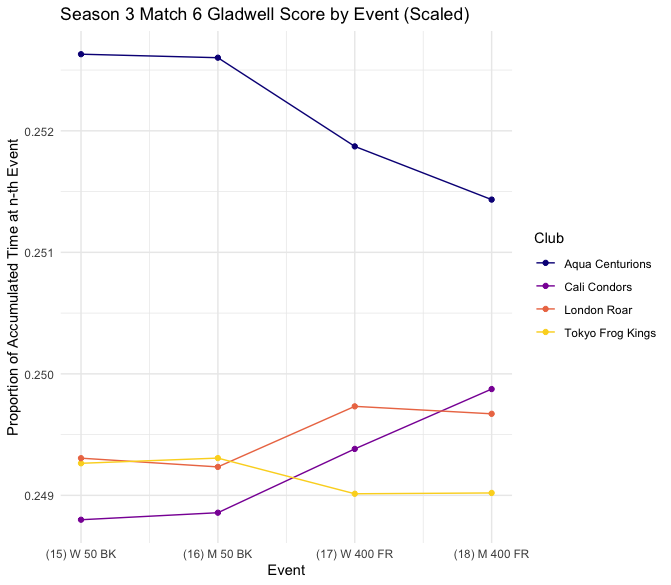
At least briefly, we can observe the relative similarity between the four teams’ accumulation of time over the last few events of the Season 3 championship match. In the graph below, the lines representing each team change at nearly the same rate from one event to the next. There is a little variation, but for the most part, the slopes of the lines in the graph below appear nearly identical. Also, their relative order (i.e., the ranking of the teams) doesn’t change.
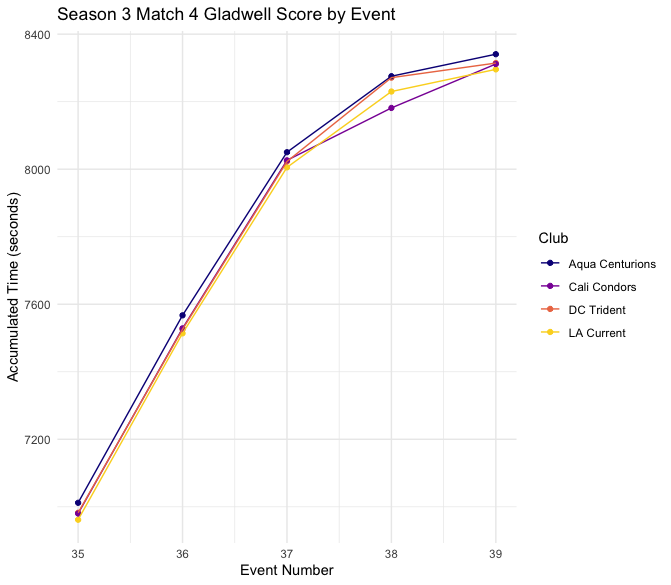
This would allude to a high degree of predictability and a low degree of competitive closeness. This is not universally true across all meets, however, which can be seen, for example, from Match 4. Recall that this was a match where Gladwell’s system would change the final team ranking. Examining the chart below, we can see, this match is notably closer and does include a few ranking changes during the final few events.
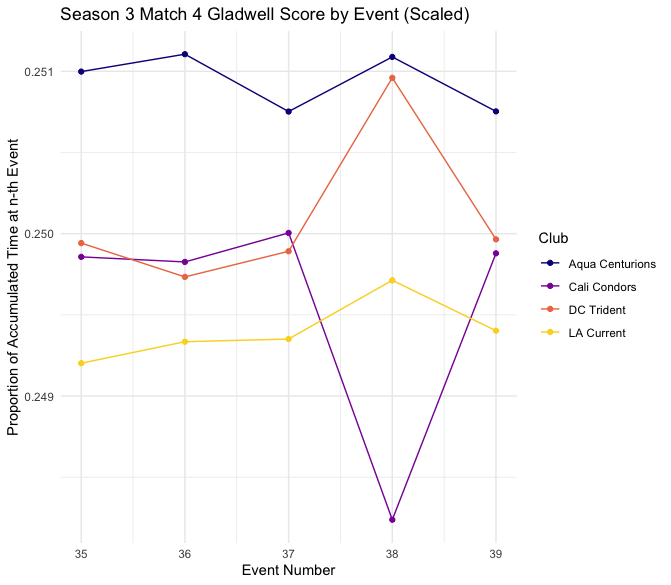
If we scale these scores out of the total time accumulated from all four teams after each event, then replot each team’s proportion (i.e., some math to make the graph clearer), we can see the ranking changes further emphasized in the plot below.
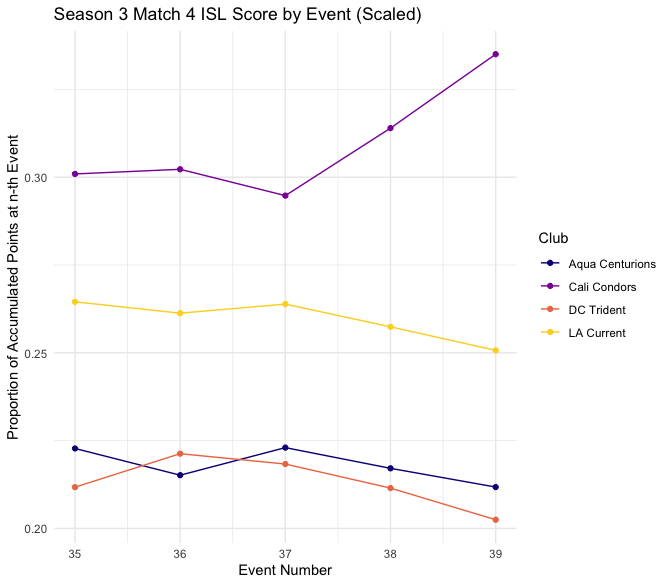
Additionally, we can contrast this with the same chart, but plotted with the point-based system instead. Here we can notice fewer lead changes and a much larger general spread (note the different scale of the vertical axis). This particular instance provides some evidence and support for the hypothesis that Gladwell’s system appears to better favor “competitive closeness.”
Thus, it seems that under Gladwell’s system, some meets will feature a “competitive closeness” (and some more so than the original system), though not necessarily all. Again, to what extent this is relevant or impactful requires a broader and more thorough analysis – one to save for another time.
Proportionality
One more thing we can consider, though, is how much this changes the value per event. Previously, sprinters and freestylers were theoretically the most highly valued swimmers simply because those events represented the largest proportion of points.²
Gladwell’s system works differently. Since distance events are longer in duration, they contribute a larger proportion of the overall score relative to the traditional system. The exact proportions will vary from match to match, as the times swum will vary from match to match, but for sake of comparison, we can examine the breakdown for Season 3’s championship match in the table below.
| Table 2: Percentage of Total Score from Match 18 by Distance | ||
| Distance | Points | Time |
| 50 | 26 | 8 |
| 100 | 41 | 39 |
| 200 | 21 | 29 |
| 400 | 12 | 24 |
Notes:
|
||
| Table 3: Percentage of Total Score from Match 18 by Stroke | ||
| Stroke | Points | Time |
| Back | 17 | 11 |
| Breast | 12 | 11 |
| Fly | 17 | 11 |
| Free | 26 | 30 |
| Medley | 27 | 37 |
Gladwell’s system increases the value of distances races and reduces the value of sprint races. It also benefits the medleys (individual and relay counted together), and the freestyle events, while reducing the relative value of butterfly, backstroke, and breaststroke. The bump in value of medley races comes from the increased significance of the 400 IM since it is of longer duration. The drop in value of fly, back, and breast, come mostly from significantly reducing the value of the skins event. These were previously worth more points than regular events, but since they are 50s, they’re of relatively shorter duration. Specifically, note that Match 18 featured Skins of women’s backstroke and men’s butterfly (this is why those strokes account for 17% of the points compared to breaststroke’s 12%).
The Tokyo Frog Kings perfectly emphasize this shift in value toward the distance races since their relative success in distance events compared to sprints propelled them up in rank under Gladwell’s system in 4 out of 5 of their matches. The most dramatic change was Match 6, where they jumped up from 4th with the original scoring to 1st with Gladwell’s. The plot below visualizes Tokyo overtaking the lead at Event 17, the women’s 400 free, where Paige Madden (1st) and Chihiro Igarashi (4th) dominated the athletes from Cali Condors and London Roar. (Aqua Centurions had some good performances too, but they were otherwise too far out of the mix for it to matter here).
This is further emphasized with a quantitative comparison. In the final results, Tokyo beat Cali and London by 5.47 and 9.07 seconds respectively. However, the accumulation of time across the 400-meter races alone is more than enough to make up that difference.
| Table 4: Match 6 Accumulated Time Across 400m Races | ||
| Team | Accumulated Time Across all 400’s | Time Relative to Tokyo (seconds) |
| Aqua Centurions | 1975.53 | -6.56 |
| Tokyo Frog Kings | 1982.09 | 0 |
| Cali Condors | 2005.01 | +22.92 |
| London Roar | 2018.6 | +36.51 |
Conclusion
So, what would happen if Malcolm Gladwell scored the ISL? The matches could be closer, though quantitative or proportional closeness may or may not contribute to a more exciting match to watch. The contributions of all athletes (the top stars and the “depth” alike) would appear to become more impactful toward the team outcome. The concept of time would be reinstated as the focal point of the sport rather than just head-to-head matchups. Distance events would have a much heavier influence on the final outcomes. And, in theory, pending further analysis of the predictability of the sport more generally (and assuming the ISL could properly tell the story and display the score intuitively, accurately, and clearly – admittedly not an automatic assumption), each meet could be more dramatic to watch throughout because every swim and every second dropped or added makes a more notable contribution to the final outcome.
Should the ISL actually instate this system? This is hard to say. Scoring is not actually very clear cut and the variety of ways to score the sport of swimming each come with different benefits and tradeoffs. Only the ISL can decide for themselves whether Gladwell’s system’s particular values align with their own. Personally, I doubt they would implement a system like this. However, it was fun to consider and explore, and I would definitely be curious to tune in if they did.
Appendix
What about DNS, DQ’s, and Skins?
Gladwell’s initial proposition of this system was intended for cross country, but swimming has a few more quirks to consider. Three main issues that need to be addressed are DNS’s / No-Swims, DQ’s, and Skins. To summarize each:
- DNS (Did Not Swim): These cause an issue because any time an athlete doesn’t swim, they don’t contribute to the total. If unaddressed, this would give an advantage to their team. If this system was to be implemented, you could theoretically also introduce a “No-DNS / No-Scratch” policy. However, this could bring on another set of potential issues and isn’t possible to consider retroactively.
- DQ’s: Although most of the DQ’d athletes end up with a finish time in the results, it feels unfair to use that time. DQ’s would typically result in no points or a point penalty, not a potentially positive contribution to the score. So, some way to penalize a DQ would need to be determined.
- Skins: The athletes who win the first and second rounds will earn additional swims, contributing more time to their total, while the losing athletes, wouldn’t add that additional time. This works in opposition to what we’d need – penalizing athletes for advancing to subsequent rounds, rather than rewarding them.
A potential solution to address all three of the issues above simultaneously is to use a time cap. For each event, we can assign a “Cap Time” to any DNS, DQ, or subsequently missed Skins race that will add more time to their total than had they swam the race normally and legally. In particular, the ISL already has a list of penalty times⁵. These were originally designed to incur point penalties for swimmers who swim too slowly, but can serve as the Cap Time here instead. For example, the Cap Time for the men’s 50m butterfly is 24.00; so, if an athlete swims a 23.00, but gets disqualified, their time will be replaced with a 24.00. This method was applied to the scoring of Season 3 for this analysis.
It would also be an option to apply the Cap Time as a default for any swimmer who performs slower than this cut-off as well, creating an artificial upper bound for each event’s score. In other words, if an athlete in the men’s 50 butterfly swam a 24.50, for instance, their score would be replaced with 24.00. However, this may cause an undesired consequence: teams could strategically and purposefully enter athletes who won’t swim faster than the Cap Time in order to potentially gain benefits in other races. I did not default any slower times to the Cap Time in my calculation of the Season 3 results because of this.
As a final note on Cap Times, the specific values would have the potential to be particularly impactful on the outcomes of matches. If the league was to implement this system, the choice of Cap Times should be considered carefully. This is especially true with the Skins races, since those performances tend to get progressively slower each round. Thus, it is probably best to assign separate Cap Times for each round of the Skins events to adequately account for this.
The Data + Author’s Note
The Data for this project was sourced from Omega Timing.⁶ They store the results for each of these meets in Lenex format (a swim-specific XML variant).⁷ I wrote a python script to convert these into CSV files to use for my analysis. However, it should be noted that there were a few data issues. In particular, relay entries were often problematic. For the most part, these entries are stored under a name, formatted like “Energy Standard” or “Energy Standard 2,” rather than a unique id. This is still relatively easy to identify when stored in this format. However, some were not stored this way. This created a few duplicated entries when running my code for certain relays in meets 3, 4, 6, and 7. In Match 3 specifically, this caused an addition of about 1000 seconds to the total of Cali’s time from multiple duplicated relay entries. I’ve corrected for these manually (and the results as corrected are what is displayed above), but I thought it should be noted here in case there were further errors in the stored results that I did not catch. I did run some checks to catch other errors, and although these results are almost certainly 99% accurate, please don’t take these specific numbers as gospel. For a “for-fun” project like this, I was aiming for “good enough” over perfection.
Finally, it is important to note that Gladwell himself did not advocate for this system for the sport of swimming, nor elite sports in general. The referenced discussion was in the context of cross country, and more specifically high school (or similarly amateur, sub-elite) level, aggregated team performances. Experimenting with extrapolating that to elite swimming was my “for-fun” swim-data project for my winter break – I have not reached out to him for comment on any of this and would encourage anyone who is curious to listen to the full podcast for context (link in the references below).
References
- Roll, R., & Gladwell, M. (2022, July 18). Malcolm Gladwell is lord of all things overlooked and misunderstood. Rich Roll. Retrieved December 30, 2022, from https://www.richroll.com/podcast/malcolm-gladwell-692/
- Gambino, S. (2019, October 16). Where swimming & strategy meet: An analysis of the ISL’s scoring system. SwimSwam. Retrieved December 30, 2022, from https://swimswam.com/where-swimming-strategy-meet-an-analysis-of-the-isls-scoring-system/
- Gambino, S. (2022, January 10). Revisiting The ISL Scoring System: An Analysis of Jackpot Points (Part 1). SwimSwam. https://swimswam.com/revisiting-the-isl-scoring-system-an-analysis-of-jackpot-points-part-1/
- Revzin, B. (2021, September 14). Jackpots: Do They Matter? SwimSwam. https://swimswam.com/jackpots-do-they-matter/
- Anderson, J. (2020, October 17). Full Scoring Format For the 2020 ISL Season. SwimSwam. https://swimswam.com/full-scoring-format-for-the-2020-isl-season/
- All Results Of The Competitions Officially Timed By OMEGA. (2021). Omega Timing. https://www.omegatiming.com/sports-timing-live-results/2021
- Kaufmann, C. (2021, November 2). Lenex 3.0 – Technical documentation. swimrankings.net. https://wiki.swimrankings.net/images/6/62/Lenex_3.0_Technical_Documentation.pdf
ABOUT STEVE GAMBINO
 Steve grew up swimming in Middletown, CT. He’s an age group coach with Crimson Aquatics where he’s coached since 2016 – first in Rhode Island, now in Wellesley, MA. Steve has an M.S. in Mathematics from University of Rhode Island, has previously served as a consultant for the ISL for the development of their rating system, and currently lives in Worcester, MA, where he works as an Assistant Professor of Mathematics at Quinsigamond Community College.
This is unnecessarily complex. In 1995, we built a program in Excel as part of Cool Coach to give points for how close a swimmer is to his best time as well as place. This would have made USA Swimming often boring senior National a lot more fun and would have given a lot more teams a chance to be a factor in the team outcome. To your points and Gladwell’s logic. ever swimmer can then matter. What I wouldn’t like about this and what I don’t like about the pro league is how often they have to swim fast. People need time to train. Maybe it would be fun to watch training sets if we made a bigger deal… Read more »
I deal with numbers, charts and probability all day long and that made my head hurt
Well done!
So interesting. Thanks for doing the math and the write up on this. After the first 10 matches, the ranks would have been completely different (assuming the same value is placed on placement in a match, 4pts for 1st, 3pts for 2nd, 2pst for 3rd and 1pt for 4th).
ENS S3: 1st-16pts MG: 1st-15pts
CAC S3: 2nd-15pts MG: 3rd-13pts
LON S3: 3rd-13pts MG: 7th-9pts
TOR S3: 4th-12pts MG: 2nd-14pts
LAC S3: 5th-11pts MG: 5th-10pts
AQC S3: 6th-10pts MG: 8th-7pts (Tie breaker: Beat IRO head-to-head)
IRO S3: 7th-8pts MG: 9th-7pts
TFK S3: 8th-6pts MG: 4th-12pts
DCT S3: 9th-5pts MG: 6th-9pts (Tie breaker: Beat LON head-to-head)
NYB S3:10th-4pts MG: 10th-4pts
This would have… Read more »
Jfed, so true! Thanks for doing this out! Obviously, I could only run the score on the playoff matches that actually occurred, but you’re totally right, the playoffs could have looked a lot different if this system was used from the beginning. Thanks!
I love this, best SwimSwam article in years. Bring the nerd on deck I say. Next up is industrial psychology and game theory. Let’s bring Kahaneman and the cookie test after we can get the U Chicago swim team to extrapolate the date. Then we’ll get the CalTech and MIT swim teams to do the math on Aumann’s game theory models. I’ll stop now lol
I love this, best SwimSwam article in years. Bring the nerd on deck I say. Next up is industrial psychology and game theory. Let’s bring Kahaneman and the cookie test after we can get the U Chicago swim team to extrapolate the date. Then we’ll get the CalTech and MIT swim teams to do the math on Aumann’s game theory models. I’ll stop now lol
Here is a summary of all the numbers and graphs:
“Imagine your car idling 24/7 to produce solved Sudokus that you could then trade for heroin.”
Thats’s how one wag described the process in which Bitcoins are mined: large farms of always-on computers crunching 200 quintillion numbers a second to solve complex cryptographic equations. Whenever a solution is found, it is posted on the Bitcoin blockchain.
Pretty much the same thing as this article! Nice job.
First off, I love the Gladwell reference here!
Otherwise I thought this was a really cool thought experiment. The first couple thoughts I had when reading this that you didnt completely explore would be to increasing difficulty to drop time at this level of competition. So while number of gap in seconds is proportionately closer than in points, its very hard to ‘find’ minutes to be dropped from swims. Sure Ledecky would have won by 10s on most events, but you cant reasonable expect her to have a slightly better swim and double it to 20s. I think you partially captured this when considering the competitive components but wanted to call it out.
To help address the difference in… Read more »
I was going to post almost the exact same thing, except with a 100m normalization. The Gladwell system works great for single-distance races. But for multiple-distance, multiple-discipline events, there needs to be some kind of normalization introduced.
They could also introduce something like how Tour de France works. There is a category for points, and a category for cumulative time.
Alternative title: “What if a distance swimmer designed the scoring system?”
On a random scoring sidenote, I remain astonished that we continue scoring dual meets with the 6-4-3-2-1 at the high school level and the 9-4-3-2-1 at the college level. It shouldn’t be that hard to get at least the college model to go 8-5-3-2-1!
Dale, having a category for each (points and cumulative time) sounds pretty cool. How would you factor them both into the overall results, team points, who makes the playoffs, etc.?
SwimmerGuy, you’re so on point with this! I totally agree that “finding” time would be pretty difficult – this is part of what I was trying to get at with the predictability piece. Under this system, matches probably become more predictable because athletes’ performances are relatively consistent. I do think that warrants a separate analysis though (which I’ll hopefully come back to at some point), so I didn’t dive deep into it here. (I’m guessing predictability is still a big consideration under the current system too).
Normalizing is something I thought about, and probably makes more sense mathematically, but to your point, it would be so difficult for a viewer to track this during a match, and since the ISL has already been criticized… Read more »