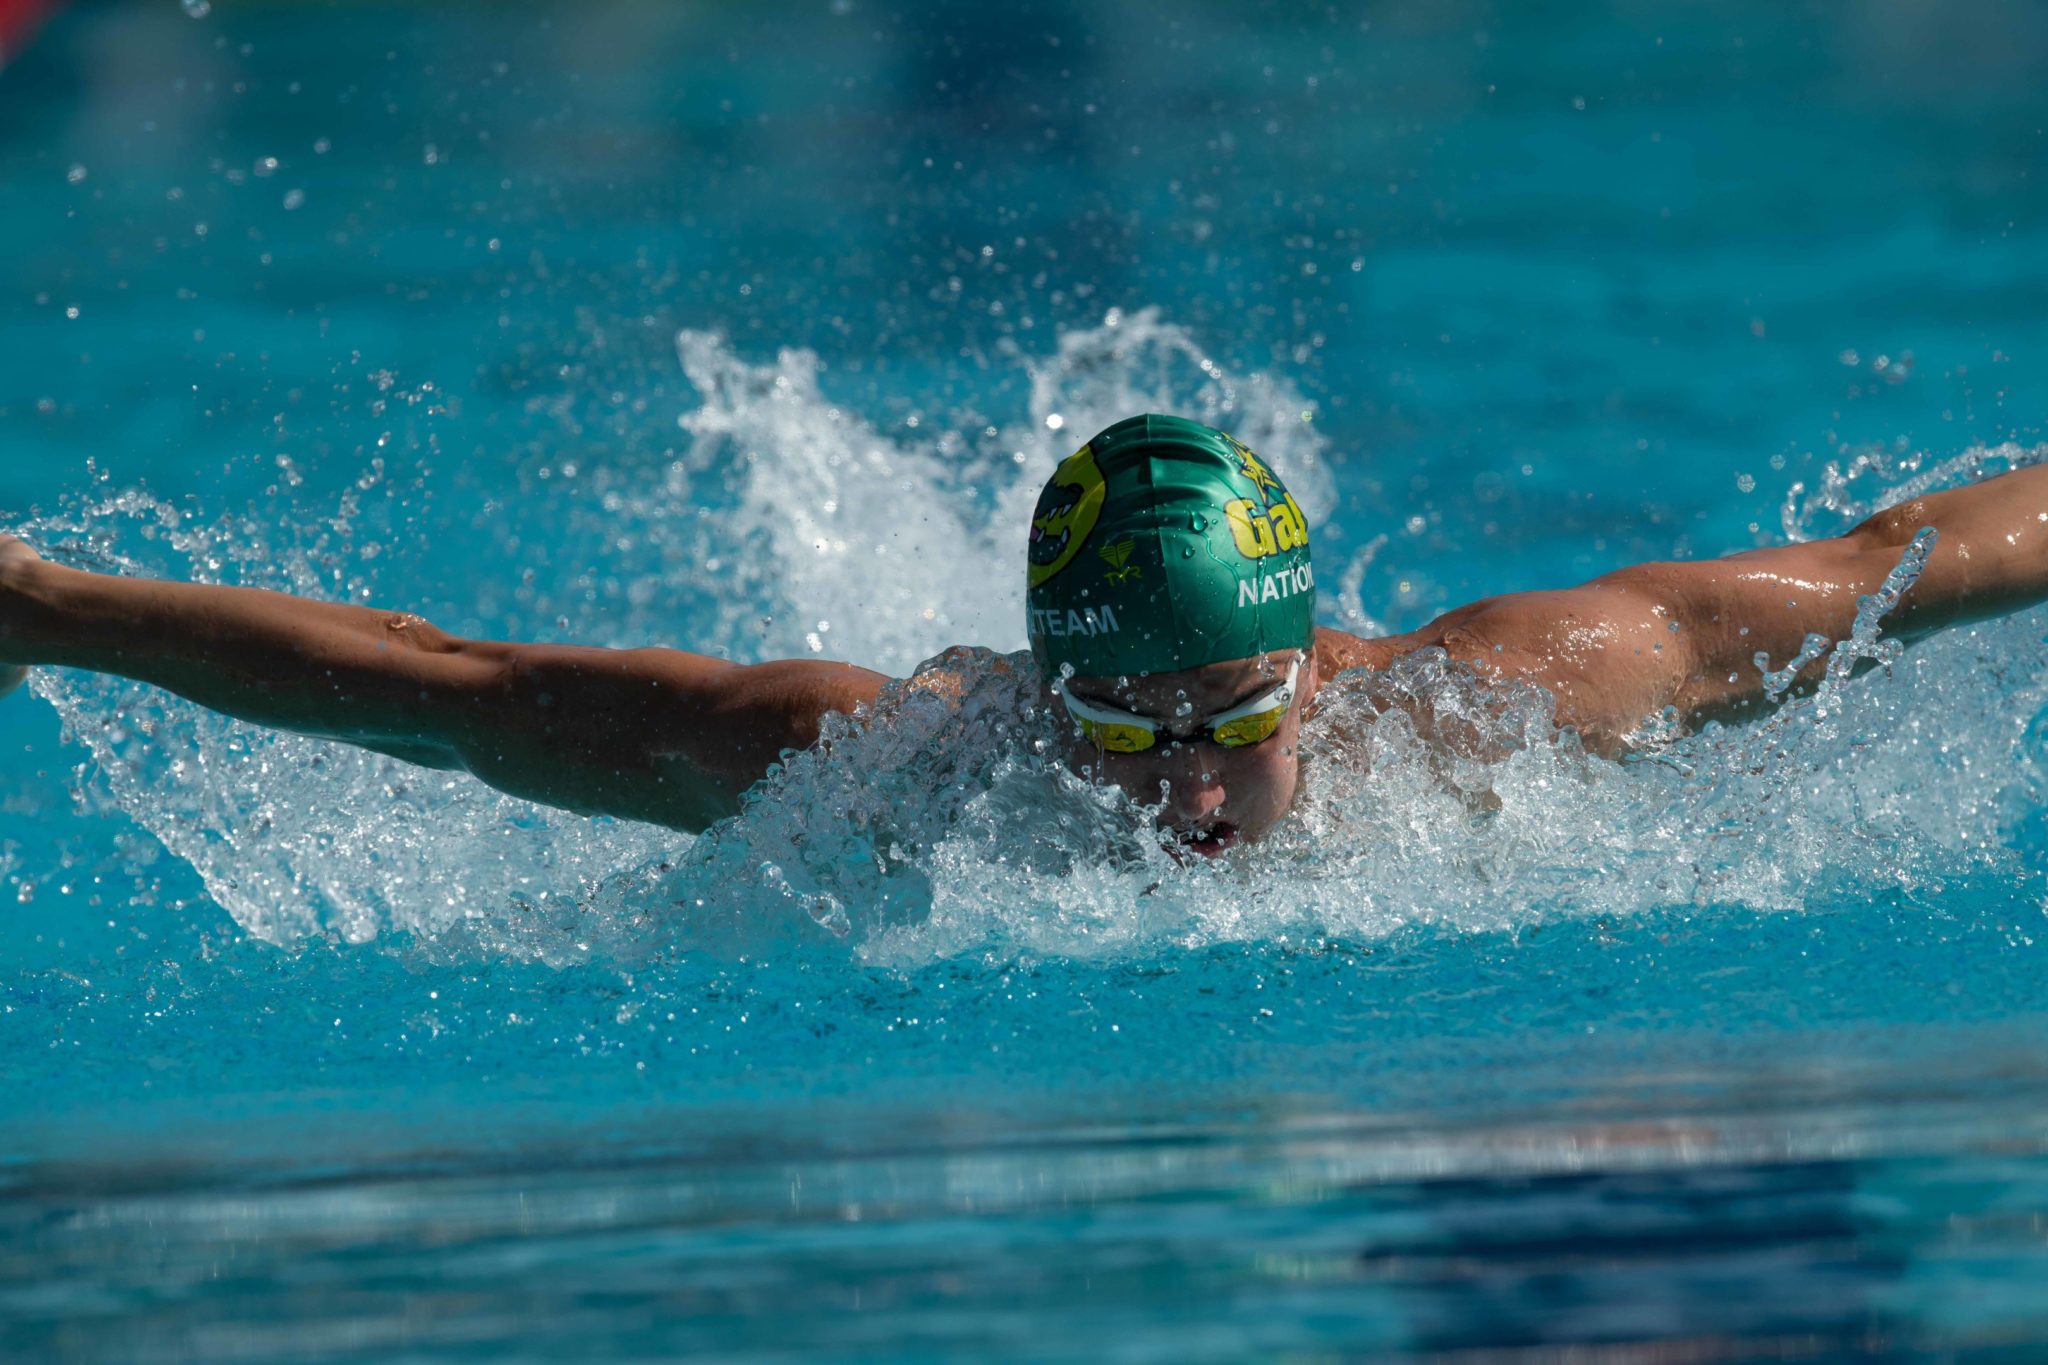
2018 U.S. NATIONAL CHAMPIONSHIPS
- Wednesday, July 25 – Sunday, July 29, 2018
- William Woollett Aquatics Center, Irvine, CA
- Prelims 9 AM / Finals 6 PM (U.S. Pacific Time)
- Meet website
- Meet information
- Event Order
- Full selection procedures
- Psych Sheet
- SwimSwam Previews Index
- TV Schedule
- Omega Results
The U.S. national championships have been fast so far at the top end compared to last year. Average times in the finals are down almost across the board
Average Finals Times
Men
| 2018 | 2017 | Diff | |
| 100 Fly | 51.71 | 51.94 | -0.23 |
| 100 Free | 48.39 | 48.38 | 0.01 |
| 1500 Free | 15:05.59 | 15:08.96 | -3.37 |
| 200 Back | 1:56.93 | 1:57.46 | -0.53 |
| 200 Breast | 2:09.54 | 2:09.90 | -0.46 |
| 200 Fly | 1:55.43 | 1:56.30 | -0.87 |
| 200 Free | 1:46.71 | 1:46.79 | -0.08 |
| 400 IM | 4:13.28 | 4:15.11 | -1.83 |
| 50 Back | 24.72 | 24.85 | -0.13 |
| 50 Breast | 27.32 | 27.36 | -0.04 |
| 50 Fly | 23.47 | 23.51 | -0.04 |
Women
| 2018 | 2017 | Diff | |
| 100 Fly | 58.03 | 58.39 | -0.36 |
| 100 Free | 53.73 | 54 | -0.27 |
| 200 Back | 2:08.54 | 2:10.23 | -1.69 |
| 200 Breast | 2:24.77 | 2:25.38 | -0.61 |
| 200 Fly | 2:08.54 | 2:09.26 | -0.72 |
| 200 Free | 1:57.00 | 1:57.09 | 0.09 |
| 400 IM | 4:38.11 | 4:39.47 | -1.36 |
| 50 Back | 28.04 | 28.10 | -0.06 |
| 50 Breast | 30.66 | 30.67 | -0.01 |
| 50 Fly | 26.44 | 26.37 | 0.07 |
| 800 Free | 8:25.16 | 8:28.67 | -3.51 |
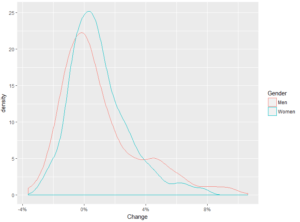
It’s easy to look at the improvement at the top end of the meet and think that everyone is dropping time like crazy this week. While some swimmers have had great meets, it’s still hard to go best times at big national meets. Only 34% of women and 42% of men managed to beat their seed times so far (this analysis excludes cases where swimmer’s seed times were from other events such as the 50’s of stroke or some distance events.) Men have added an average of 1% to their seeds so far (median .3%, 576 data points). Women have added an average of 1% to their seed times (median .7%, 622 data points). Those numbers are pretty typical and fall in line with other big national meets.
The most likely explanation for the improvement at the top end of the meet is that the field of swimmers are better than last year.
Distribution of Time Changes vs Seed (negative is faster, positive is slower)
There have been some big time drops so far and those are worth highlighting. The top 20 time drops vs seed for men and women are in the tables below. Some seed times were yards times converted to meters. For this article those converted times were used and taken at face value.
For men the biggest time drop by percentage so far was Noah Bowers of Virginia Gators in the 100 fly where he beat his 55.87 100 fly seed time by 2.03 seconds. The biggest drop for women came from Mackenzie Looze of Indiana Swim Team whose 2:29.94 200 breast was a 4.59 improvement on her seed time.
Men
| Name | Club | Event | Time | Seed | Change | |
| 1 | Bowers, Noah | Virginia Gators | 100 Fly | 53.84 | 55.87 | -3.6% |
| 2 | Chaney, Adam | Mason Manta Rays | 100 Free | 49.95 | 51.81 | -3.6% |
| 3 | Stewart, Coleman | Nc State University | 100 Fly | 52.17 | 54.1 | -3.6% |
| 4 | Finke, Robert | Saint Petersburg | 400 Medley | 4:15.79 | 4:25.14 | -3.5% |
| 5 | Iida, Sam | Glenview Titan Aquatic Club | 200 Breast | 2:11.80 | 2:16.15 | -3.2% |
| 6 | Urlando, Gianluca | Dart Swimming | 200 Fly | 1:55.21 | 1:58.93 | -3.1% |
| 7 | Casas, Shaine | Aggie Swim Club | 200 Back | 1:58.65 | 2:02.03 | -2.8% |
| 8 | Giller, Robby | Cavalier Swimming | 400 Medley | 4:19.06 | 4:26.31 | -2.7% |
| 9 | Devine, Abrahm | Stanford Swimming | 200 Free | 1:47.78 | 1:50.77 | -2.7% |
| 10 | Julian, Trenton | Rose Bowl Aquatics | 200 Fly | 1:56.20 | 1:59.31 | -2.6% |
| 11 | Khosla, Raunak | Dynamo Swim Club | 200 Fly | 2:00.47 | 2:03.65 | -2.6% |
| 12 | Julian, Trenton | Rose Bowl Aquatics | 200 Free | 1:47.57 | 1:50.39 | -2.6% |
| 13 | Julian, Trenton | Rose Bowl Aquatics | 200 Fly | 1:56.27 | 1:59.31 | -2.5% |
| 14 | Farris, Dean | Harvard Swimming | 100 Free | 48.52 | 49.75 | -2.5% |
| 15 | Seliskar, Andrew | California Aquatics | 200 Free | 1:45.70 | 1:48.35 | -2.4% |
| 16 | Harder, Ethan | Billings Aquatic Club | 200 Fly | 2:00.81 | 2:03.82 | -2.4% |
| 17 | Scheinfeld, Charles | New Trier Aquatics | 200 Breast | 2:14.68 | 2:17.94 | -2.4% |
| 18 | Stewart, Sam | Unattached | 400 Medley | 4:13.65 | 4:19.69 | -2.3% |
| 19 | Dahlgren, Jack | Aquajets Swim Team | 200 Fly | 1:59.10 | 2:01.85 | -2.3% |
| 20 | Saunderson, Jack | Towson University Swimming | 100 Fly | 51.48 | 52.66 | -2.2% |
Women
| Name | Club | Event | Time | Seed | Change | |
| 1 | Looze, Mackenzie | Indiana Swim Team | 200 Breast | 2:29.94 | 2:34.53 | -3.0% |
| 2 | Sumrall, Micah | Chattahoochee Gold Swim Club | 200 Breast | 2:22.06 | 2:26.16 | -2.8% |
| 3 | Sarazen, Kyra | Irish Aquatics | 200 Back | 2:11.37 | 2:15.09 | -2.8% |
| 4 | Moroney, Megan | Cavalier Swimming | 200 Back | 2:10.53 | 2:14.15 | -2.7% |
| 5 | Seidt, Asia | Kentucky Aquatics | 200 Fly | 2:09.62 | 2:13.14 | -2.6% |
| 6 | Weitzeil, Abbey | California Aquatics | 100 Free | 53.56 | 54.99 | -2.6% |
| 7 | Small, Meghan | Tennessee Aquatics | 100 Fly | 59.27 | 1:00.83 | -2.6% |
| 8 | Bonnett, Bailey | Kentucky Aquatics | 200 Breast | 2:27.35 | 2:31.04 | -2.4% |
| 9 | James, Lauren | University Of Louisville | 200 Breast | 2:29.00 | 2:32.57 | -2.3% |
| 10 | Smith, Regan | Riptide | 200 Fly | 2:07.42 | 2:10.47 | -2.3% |
| 11 | Lazor, Annie | Mission Viejo Nadadores | 200 Breast | 2:24.42 | 2:27.87 | -2.3% |
| 12 | Ivey, Isabel | Laker Swim | 100 Fly | 59.29 | 1:00.67 | -2.3% |
| 13 | Pfeifer, Evie | Longhorn Aquatics | 200 Free | 1:58.54 | 2:01.19 | -2.2% |
| 14 | Sullivan, Erica | Sandpipers Of Nevada | 200 Back | 2:14.45 | 2:17.44 | -2.2% |
| 15 | Kovac, Bailey | Indiana University | 200 Breast | 2:28.92 | 2:32.17 | -2.1% |
| 16 | Goettler, Laura | Lake Erie Silver Dolphins | 200 Breast | 2:29.38 | 2:32.62 | -2.1% |
| 17 | Sargent, Makayla | Irish Aquatics | 400 Medley | 4:40.24 | 4:46.07 | -2.0% |
| 18 | Madden, Paige | Cavalier Swimming | 200 Free | 1:58.50 | 2:00.96 | -2.0% |
| 19 | Denigan, Mariah | Northern Ky Clippers Swimming | 800 Free | 8:28.15 | 8:38.64 | -2.0% |
| 20 | Walsh, Gretchen | Nashville Aquatic Club | 100 Free | 54.38 | 55.5 | -2.0% |
Be great to get some median data since averages are sometimes skewed by outliers. Also depth comparison. What times did it take to make finals or even top 16/24 just to get a broader comparison of depth.
But this is finals times data. A really fast winning time or really slow times at the back end of the heat are part of the overall speed of the heat. With the small number of data points and the goal of capturing the entire data set, I think averages are better in this case. Medians are usually better, but in this case I prefer an average. We have the entire final. Outliers arguably don’t exist when the sample is the entire population. A median here is just the average of the 4th and 5th place times. By using it we’re throwing out a lot of information. I reported the medians for the overall time drop distributions where they are… Read more »
A depth comparison would be useful. I did a partial look at that on day 1.
Check it out here: https://swimswam.com/u-s-nationals-day-1-prelims-much-faster-than-recent-nationals/
I might do a more complete version after the meet.
Good stuff! In the 200 free women, the 0.09 diff is in wrong direction. The figure of distribution of time changes is interesting. Men overall are doing slightly better than women. Can this same figure be repeated and compared for men2017 vs men2018 and for women?
This is why I shouldn’t do subtraction manually. Sign error corrected. The 2017 data looks pretty similar. I have the 2017 data in a different format, so overlaying it is annoying. By visual inspection, it’s pretty similar.
Thanks for your efforts! I am a stats person too, so love this!
Thanks for this. Very interesting. Is Trenton Julian the son of olympian Kristine Quance?