
Courtesy: Steven Gambino
The past year has been arguably the most unusual 365 days for the sport of swimming in quite some time. With the absence of an Olympics and an NCAA champs, as well as more time away from the pool than many athletes and coaches (myself included) have spent in their entire lives, things have certainly looked a little different for our sport. While this is unfortunate in many ways, the past year has also brought some really exciting changes that aim to push our sport to grow and evolve further in the years to come. Perhaps the most notable of these changes is the formation of the International Swim League (ISL).
The ISL’s inaugural season in the fall of 2019 brought to the sport a new level of professionalism, a team-based competitive format, and the most immersive spectator experience we’ve seen in swimming yet, all of which have already made a profound impact on the sport. It is also apparent that this is only just the beginning. We’ve seen some elements of this already, as they’ve added a jackpot bonus amendment to their scoring system, announced new teams from Toronto and Tokyo, and expanded their schedule for 2020. In addition to all of this, the league will be adding a new swimmer rating system.
Why Rate Athletes?
When you tune in to watch an NCAA basketball game at the end of March and see a one-seed competing against a sixteen-seed, who do you expect to win? How confident are you in that prediction? How about if you see an eight-seed play against a nine-seed?
This is just one of many examples of a rating system in sports, but it illustrates their importance because of the system’s ability to communicate, at least on some level, what can be expected from a given matchup. While basketball experts may be able to look at a matchup between two teams and determine that one team with a strong defense close to the basket has a good chance to beat a team with weak 3-point shooters, a casual viewer may not be as informed to such nuances, making things feel a bit more opaque. A rating system can add some insight to help make these expectations and narratives more transparent and accessible.
For instance, we understand that a one-seed is almost guaranteed to beat a sixteen-seed. When this happens, the narrative is “per usual.” If this does not happen, even without knowing any specifics of those teams, we understand the narrative that such an occurrence would be an enormous upset. Similarly, we can understand that a matchup between an eight- and nine-seed would likely be much more even. The seeds themselves help us, as audience members, create a deeper connection with the story and drama of the competitions. Speaking personally as only a very casual basketball fan, this type of ranking is critical for my understanding, enjoyment, and engagement with the March Madness competition. Similarly, the swimmer rating system for the ISL will hopefully help foster this deeper connection with the sport and the league for both casual and serious fans alike.
So, consider if a viewer tuned in to watch the Women’s 100m Fly in Vegas from 2019. Rather than just seeing a bunch of names that may or may not look vaguely familiar, they would have seen, for example, Emma Mckeon (rated at 4748), Sarah Sjostrom (4379), and Natalie Hinds (1258), etc. The viewer now has a reasonable expectation that Emma and Sarah might have a pretty tight race at the top of the heat and that both will most likely beat Natalie. This is, in fact, what occurred.

However, if we also note Anastayisa Shkurdai’s rating of 1734 prior to this race, we can understand her victory over Emma as an important upset win for Energy Standard against the London Roar.
One of the main ways human beings interpret the world around them in general or more specifically, the world of sport, is though narrative. The introduction to a rating system for swimmers can help make such narratives more interesting, accessible, and hopefully, support the continuing growth of the sport and the ISL.
The Challenge of Creating a Rating System
Creating such a rating system, however, is not an easy task. The numerous variables and factors that go into constructing such a system can make it quite challenging to build one to reflect performances as accurately as possible. In fact, creating a “perfect” system is not actually possible. To be clear, I don’t mean this in a clich´e “nothing is perfect” kind of way, rather in a more mathematically-rigorous sense.
Math is objective. Swimming competition is also objective. However, the same cannot always be said about their intersection. This is because evaluating performances and assigning a ranking or rating, though using both the objective swimming result and objective mathematical tools, requires a subjective interpretation in the application of those tools and thus, is influenced by the ratings’ creator and their values.
For example, as I wrote in a previous article, “Where Swimming & Strategy Meet: An Analysis of the ISL’s Scoring System,” we can understand a bit of what the ISL values in regards to scoring from an examination of their scoring system. Specifically, one point I argued was that the league’s system was constructed to value their star-powered sprinters. We see this by noting, for example, that sprint races make up the largest percentage of the total available points, winning the skins event is worth three times as much as other individual races, and race winners bring a high probability of earning the most total points overall for the event to their team. Furthermore, the recent addition of a jackpot bonus further highlights the top stars as it provides an even greater opportunity for them to earn big points for their teams.
So, if the accuracy and effectiveness of a rating system is relative to the league’s values, it is important to understand their perspective and the criteria they prioritize. These are the fundamental things this system aims to achieve.
- Zero Sum. At any given time, the system holds a fixed amount of value. In order for one swimmer’s rating to increase, another’s must decrease. This is important because, perhaps unlike real-world economics, a win for one team means a loss for the others; when one athlete capitalizes on an opportunity to earn points, another athlete misses that opportunity. This nature stays fixed within the competition in the pool and so the league’s rating system will reflect that.
- No Inflation. The total value of the system can only increase or decrease if the number of athletes in the league increases or decreases. To make another reference to economics, inflation occurs when the value of currency drops. In other words, purchasing a pack of gum today may cost $1.50, when 50 years ago that same pack of gum only cost $.75. For the ISL’s system, the same performance relative to competitor’s rankings ought to produce the same rating over time, rather than decaying, at least assuming the size of the league stays fixed.
- Degree of Difficulty. Simply put, beating tougher, more highly rated competitors is more beneficial to one’s rating than beating slower, lesser rated competitors.
- Non-Absolute Measurement The ISL’s ratings are determined by the relative outcomes of direct competitions, not by an athletes’ absolute swim time or even their swim time relative to some fixed standard (like a World Record). Ratings like this exist already in the sport of swimming – specifically, the power points system. Though the details vary a bit depending on the specific system, these types of ratings generally give a score between one and eleven hundred based on how close they are to the designated time standard. Instead, the ISL’s system is more of a game of ”who beat who” than ”how fast.”
- Non-Participation Penalty. The ratings of swimmers who are eligible for a race, but do not compete, will be negatively affected.
Other mathematical principles that the system will satisfy and may seem obvious, but are worth mentioning: 6. Non-Dictatorial. The ratings won’t be determined by a single person, race, or match.
- Deterministic. Basically, this means no randomness will be factored in. Given an input of season’s match results, there is only one possible output for the ratings determined by the system. (Mathematically, this means the system is a function that takes match results as inputs and yields ratings as outputs).
- Monotonicity. If results were to be adjusted so swimmer A moves up in place, their rating must remain the same or improve; it cannot go down.
- Non-Imposition. Every possible ranking is theoretically achievable. (Mathematically, this means the system is specifically a surjective function. I should note for the math lovers out there, it is not a bijection due to the jackpot bonus. In other words, it is not ”invertible” and thus, you can’t infer the match results from the ratings).
Since no ”perfect” system is possible, when choosing what to value, you’re simultaneously choosing what not to value (what properties must be excluded or sacrificed). Some properties of ratings systems that were not prioritized and are not met by the ISL’s are:
- Unanimity. It is possible within the current rating system for an athlete to win against all competitors and still not be ranked the highest. This won’t necessarily be a likely or common occurrence, but it is theoretically possible.
- Independence of Irrelevant Alternatives. Simply put, the results between direct competition of swimmer A and swimmer B could indirectly impact the ranking of swimmer C. Note: I’ve labeled this as an “imperfection,” based on traditional social ordering theory, however, it is arguable that this isn’t desirable in some instances for the ISL’s purposes anyway because, in some sense, it runs in contradiction to the “degree of difficulty” criteria. There exists more nuance here, but more or less, its absence isn’t all good or all bad.
- Strategic Thinking. The system can be ”gamed” by athletes/coaches to influence the results of the ratings. This won’t always be an issue since the rating of the athlete is at most the second priority to winning the match and so decisions like ”throwing” a race by a swimmer to help boost another athlete’s ratings are probably unlikely, but it is technically possible.
I should be clear that the absence of these does not mean the system is bad or lacking, it isn’t. No system can juggle all properties at once, so these were things that needed to be left out. Further, while in certain contexts of ranking and rating systems, like elections for example, lacking these properties can potentially become particularly problematic, they are not as much of an issue for something like rating competitive swimming.
Lastly, the nature of the sport of swimming presents an additional complication. Many rating systems across sports like tennis and chess, use some variation of what is known as an Elo System. Essentially, when two chess players compete, their ratings are adjusted based on the results of their match and the difference of their ratings prior to the match. Though the ISL’s system takes inspiration from this method, currently these Elo systems are designed to work well for one v. one competitions. They will require adjustments to account for 8 swimmers racing in a heat and up to 56 other eligible athletes (based on current roster sizes) sitting out of a race.
How it Works
Now that we understand what we’re aiming for, what is the actual math going on behind the scenes to make it happen? I’ll split this section into two parts. First, I’ll give the straight-to-the-point mathematics, the algorithm, the formulas, as developed by the league’s president, Konstantin Grigorishin. Second, I’ll provide a more intuitive explanation. I should note, that for the sake of full transparency, it is important to include the raw formulas. However, these can be algebra-heavy and so depending on your interest in the specifics of the math, it may be worth reading section two first while possibly (or possibly not) referencing section one as needed. I’ve numbered the formulas so it will be clear to what I’m referencing, but I’ve also written section two to be able to exist on its own whether or not you ever read or reference section one. [And I will only take it a little personally if you skip it ,].
1 The Math
1.1 Initial Conditions
Every athlete will be given a rating for each competitive event. At the outset of the system, the following ratings will be assigned for each event type:
- Individual Events: 1000
- Skins Events: 2300
- Relay Events: 500
These will be assumed for a set of ten matches. For each new meet, athletes will receive a new event rating to be averaged with the ten previous ratings, giving them an average rating for each event.
These initial scores of 1000, 2300, and 500 can be thought of as a ”neutral-point,” and will be referred to as such throughout the remainder of the article. This rating will also be given to any athlete entering the league after the start of the system.
Every team will be assumed rosters of eighteen male athletes and eighteen female athletes. This is intended to be the maximum number of athletes a team is permitted to carry, but if they carry fewer, then ”virtual athletes” will be assumed as placeholders to preserve the total sum of the rating system. Thus, at each meet, every individual, skins, and single-gender relay event will maintain seventy-two athletes (k = 72), and mixed relays will maintain one hundred forty-four (k = 144). (Note: The league currently permits a maximum roster of sixteen athletes per gender, however, DC Trident and NY Breakers violated this rule last season, and so ratings for 2019 were calculated based on rosters sizes of eighteen to account for this.)
1.2 Match Ratings
At the end of each individual event, every athlete, A, competing in match i will be given an Individual Event Rating, called, based on their points earned in the race and the ratings of their opponents. This rating is specific to the given event and will be determined by
\begin{align}
r^A_i = \begin{cases}
\dfrac{P_A}{37} \cdot \left( \sum\limits_{s = 1}^8 R_{i, s} + \alpha \left( 1000k – \sum\limits_{s=1}^8 R_{i, s} \right) \right) \hspace{1 cm} \text{ for each participating athlete }\\
(1-\alpha)\cdot \left( \dfrac{1000k-\sum\limits_{s=1}^8 R_{i, s} }{k-8}\right) \hspace{1.85cm} \text{for each nonparticipating eligible athlete.}
\end{cases}
\end{align}
where $P_A$ is the points earned by athlete $A$ in the event, $R_{i, s}$ is the current average event rating of each event-participating athlete, $k = 72$, and $\alpha$ is a constant such that $0 < \alpha < 1$.
At the end of each skins event, every athlete, $A$, competing in match $i$ will be given a Skins Event Rating, called $r^A_i$, based on their points earned in the race and the ratings of their opponents. This rating is specific to the given event and will be determined by
\begin{align}
r^A_i = \begin{cases}
\dfrac{P_A}{85} \cdot \left( \sum\limits_{s = 1}^8 R_{i, s} + \alpha \left(2300k – \sum\limits_{s=1}^8 R_{i, s} \right) \right) \hspace{1 cm} \text{ for each participating athlete }\\
(1-\alpha)\cdot \left( \dfrac{2300k-\sum\limits_{s=1}^8 R_{i, s} }{k-8}\right) \hspace{1.85cm} \text{for each nonparticipating eligible athlete.}
\end{cases}
\end{align}
where, again, $P_A$ is the points earned by athlete $A$, $R_{i, s}$ is the current average event rating of each eventparticipating athlete, $k = 72$, and and $\alpha$ is a constant such that $0 < \alpha < 1$.
At the end of each single-gender relay event, every athlete, $A$, competing in match $i$ will be given a Relay Event Rating (Single-Gender), called $r^A_i$, based on their points earned in the race and the ratings of their opponents. This rating is specific to the given event and will be determined by
\begin{align}
r^A_i = \begin{cases}
\left( \dfrac{1}{16} + \dfrac{3}{4}\cdot \dfrac{R^A_i}{R^R} \right) \dfrac{P_A}{74} \cdot \left( \sum\limits_{s = 1}^{32} R_{i, s} + \alpha \left(500k – \sum\limits_{s=1}^{32} R_{i, s} \right) \right) \hspace{0.5 cm} \text{ for each participating athlete }\\
(1-\alpha)\cdot \left( \dfrac{500k-\sum\limits_{s=1}^{32} R_{i, s} }{k-32}\right) \hspace{1.85cm} \text{for each nonparticipating eligible athlete.}
\end{cases}
\end{align}
where, $P_A$ is the points earned by the athlete’s relay, $R_{i, s}$ is the current average event rating of each event-participating athlete, $R^A_i$ is the current average rating of the athlete $A$, $R^R$ is the sum of the average ratings of the athletes on athlete A’s relay, $k = 72$, and $\alpha$ is a constant such that $0 < \alpha < 1$.
At the end of each \underline{mixed relay event}, every athlete, $A$, competing in match $i$ will be given a \textbf{Relay Event Rating (Mixed)}, called $r^A_i$, based on their points earned in the race and the ratings of their opponents
This rating is specific to the given event and will be determined by
\begin{align}
r^A_i = \begin{cases}
\left( \dfrac{1}{16} + \dfrac{3}{4}\cdot \dfrac{R^A_i}{R^R} \right) \dfrac{P_A}{74} \cdot \left( \sum\limits_{s = 1}^{32} R_{i, s} + \alpha \left(500k – \sum\limits_{s=1}^{32} R_{i, s} \right) \right) \hspace{0.5 cm} \text{ for each participating athlete }\\
(1-\alpha)\cdot \left( \dfrac{500k-\sum\limits_{s=1}^{32} R_{i, s} }{k-32}\right) \hspace{1.85cm} \text{for each nonparticipating eligible athlete.}
\end{cases}
\end{align}
where, again, $P_A$ is the points earned by the athlete’s relay, $R_{i, s}$ is the current average event rating of each event-participating athlete, $R^A_i$ is the current average rating of the athlete $A$, $R^R$ is the sum of the average ratings of the athletes on athlete A’s relay, $k = 144$, and $\alpha$ is a constant such that $0 < \alpha < 1$.
-
-
Disqualifications
-
The case of an athlete or relay being disqualified from an event requires an adjustment to the above formulas. This adjustment will be applied similarly regardless of event type.
When an athlete is disqualified, they earn $P_A = -2$ points in the meet. However, this will not factor into their rating. Instead, it is best to consider this as a two point penalty toward their team’s score, but an earned score of 0 points for the individual. Thus, $P_A$ will be set to zero. Further, for $n$ athletes disqualified in a given event, $\dfrac{n(n+1)}{2}$ points will be added to the event winner’s score, similar to the jackpot bonus. This preserves the sum of points available in individual, skins, and relay events to be thirty-seven, eighty, and seventy-four respectively.
This preserves the sum of points available in individual, skins, and relay events to be thirty-seven, eighty, and seventy-four respectively.
-
-
Athlete Ratings
-
For every event, each athlete A will receive an Average Event Rating to summarize their performances in the event over the previous ten matches, given by
\begin{align}
R^A_j = \sum_{i=j-9}^j \frac{r^A_i}{10}
\end{align}
where j is the number of their most recent match.
-
-
Aggregate Rating
-
Each athlete will be given an aggregate rating designed to summarize their ratings across every event. This will be computed as a sum of each of their Average Event Ratings for all individual, skins, and relay events.
-
-
Redistribution
-
When athletes leave the league, all previous average rankings will be adjusted by
\begin{align}
R^A_i = R^A_i – \Delta R^A_i \text{ , where} \\
\Delta R^A_i = \dfrac{\sum\limits_{m=1}^{M_i} R^{A-}_{i,m} – 1000M_i}{K-M_i}
\end{align}
where K is the number of athletes in the league and Mi is the number of athletes that left the league after match i.
-
The Intuition
The rating system has been retroactively applied to the 2019 season and I will be using these ratings as examples throughout this section. The 2019 ratings include the application of the jackpot bonus and the updated scoring for skins events even though these rules will be new in 2020. Thus, specific meet results may look different here than they actually occurred.
-
-
Athlete Ratings
-
First, for every event in the ISL, every athlete will receive a rating score each match (lowercase r from the formula). This score will reflect their performance on that given day. For example, in the Women’s 100m Freestyle from the first match of the 2019 season in Indy, the following ratings were determined based on the results of the race.

The athletes’ rating (capital R from the formula) will be an average of their rating scores from the previous ten matches. For the beginning of the system and for any new athletes entering the league who have not competed in ten previous matches to draw from, these will each be assumed at a rating of 1000, where 1000 can be thought of as a neutral-point of the system. This is done to preserve the zero-sum and no-inflation properties. Thus, the athlete’s rating for the 100 FR after Indy would be updated from an initial 1000 to the following.

To see how this is computed, let’s consider Larissa Oliviera’s rating. This is the first match so she has 10 ”virtual matches” of a rating of 1000, and a score from this match of 0. To compute her rating, we average this match’s score with the previous nine matches, which gives,
\begin{align*}
R = \dfrac{1000 + 1000 + 1000 + 1000 + 1000 + 1000 + 1000 + 1000 + 1000 + 0}{10} = \dfrac{9000}{10} = 900.
\end{align*}
The same process is repeated for all other swimmers at the match, including athletes that did not participate in the event, though those are not listed above.
-
-
Individual Event Ratings
-
Now, how does Larissa’s score of 0, Sarah Sjostrom’s score of 16,216, Siobhan Haughey’s score of 7,568, etc., get determined in the first place? Well, remember that at the beginning of the season, every athlete is allocated a value of 1000 for their rating. This means, for an event like the Women’s 100m FR, where there are four teams with sixteen eligible women to compete (eighteen are factored into the rating system – see Section 1.1), the total amount of value going into this race is (1000/swimmer)(4 teams)(18 swimmers/team) = 72,000, specifically, 8000 from the eight athletes competing in the race, and 64,000 from the athletes who are not participating. After the race, depending on the results, you can imagine the value being redistributed as follows.
-
A portion of the 64,000 of the non-participating athletes will be distributed to the participating athletes. This is to award the athletes who participate more than the ones who don’t. The specific proportion is determined by the α parameter in equation (1). α varies depending on the event type, which I will discuss later, but for the Women’s 100m Fly, along with all other individual events, α = 0.5. So, half of that 64,000 will get redistributed to the participating athletes and the other half will return to the non-participating athletes.
-
Value to be distributed to Participating athletes = $8,000 + \dfrac{64,000}{2} = 40,000$
-
Value to be distributed to Non-Participating athletes = $\dfrac{64,000}{2} = 32,000$
-
-
Non participating athletes will each receive an equal portion of the $32,000$.
-
Participating athletes will receive part of the 40,000 proportional to the points they earned in the race. For example, since there are 37 total points available, Sarah Sjostrom earned $\frac{15}{37}$ points, and thus $\dfrac{15}{37} \cdot 40,000 \approx 16,216$.
These numbers are then averaged with their scores from the previous ten matches to determine their rating. This process will repeat at all subsequent matches, the only change being that instead of everyone starting with 1,000, they’ll start with their current average rating. In other words, Sarah Sjostrom would bring 2,522 to the next match in Naples, Siobhan Haughey would bring 1,657, etc.
-
-
-
Realization of Degree of Difficulty Property
-
-
This is how the ”degree of difficulty” is factored in. Competitors who have performed well will accumulate more value and thus bring more to be distributed amongst participating athletes in their future competitions. Again considering the Women’s 100m FR as an example, let’s compare the total value of competitors in the event at the championships in Vegas (a highly competitive race) to the total value of the competitors in the event at College Park (where the event was not as competitive).

The final season rankings are provided as reference. Although there are some strong competitors like Beryl Gastaldello and Siobhan Haughey at the College Park meet, it doesn’t compare in overall competitiveness to the event in Vegas, filled with stars like Emma Mckeon, Sarah Sjostrom, and Cate Campbell. This is reflected in the total value of the event, 11,759 and 18,696 between College Park and Vegas respectively. This demonstrates, for example, a second-place finish in Vegas is worth more than a second-place finish in College Park because $\frac{7}{37} (18696) > \frac{7}{37}(11759)$. Therefore, athletes are rewarded more for beating more difficult competition.
-
-
Skins Event Ratings
-
This process is almost identical for the skins events, with just a few minor changes. Looking at equation (2), you’ll notice a difference of 2,300 as a neutral-point instead of 1000, and a factor of $\frac{P_A}{85}$ for participating athletes since there are 85 total points available for the skins races, instead of the 37 available in individual events. Otherwise, the ratings are computed in the same manner.
-
-
Relay Event Ratings
-
Relays, however, force us to adjust this a bit further, due to the added complications of both single and mixed gender relays and a team of four athletes that earn the points, rather than a single individual. To account for this, you’ll notice equations (3) and (4) have some adjustments including a new neutral-point of 500, a factor of $\frac{P_A}{74}$ for the 74 available points in relay events, as well as an additional factor being multiplied out front of the participating athletes’ expression. This factor, $\left( \dfrac{1}{16} + \dfrac{3}{4}\cdot \dfrac{R^A_i}{R^R} \right)$, is what determines how the ratings will be distributed between athletes on a relay because for a relay made up of athletes $A_1, A_2, A_3,$ and $A_4$,
\begin{align*}
& \left( \dfrac{1}{16} + \dfrac{3}{4}\cdot \dfrac{R^{A_1}_i}{R^R} \right) + \left( \dfrac{1}{16} + \dfrac{3}{4}\cdot \dfrac{R^{A_2}_i}{R^R} \right) + \left( \dfrac{1}{16} + \dfrac{3}{4}\cdot \dfrac{R^{A_3}_i}{R^R} \right) + \left( \dfrac{1}{16} + \dfrac{3}{4}\cdot \dfrac{R^{A_4}_i}{R^R} \right)\\
&= 4 \left( \dfrac{1}{16} \right) + \dfrac{3}{4} \cdot \dfrac{R^{A_1}_i + R^{A_2}_i + R^{A_3}_i + R^{A_4}_i}{R^R}\\
&= \dfrac{1}{4} + \dfrac{3}{4} \cdot \dfrac{R^R}{R^R} \\
&=1.
\end{align*}
Essentially, the value is distributed to each member relative to their portion of the relay’s total rating, but ensuring they recieve a minimum of $\frac{1}{16}$ of the value. This provides a way to answer the question of how much value each athlete contributes to their respective relay teams.
A possible way to account for this is to determine the rating based on proportions of time. For instance, in a 4x100m Freestyle relay, if all four athletes split times of 25.00, then each should receive $\frac{25.00}{4(25.00)} = \frac{25.00}{100.00} = \frac{1}{4}$ of the value they earned as a group. However, this has some complications when you consider discrepancies in times for relay- and flat-starts, different strokes in medley relays, and different genders in mixed relays. Instead, the rating is only dependent on proportions of ratings of the individual relay members, relative to the total relay value, in other words, $\dfrac{R^A_i}{R^R}$.
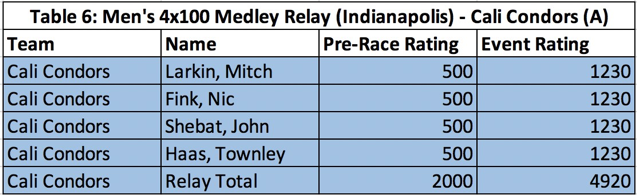
Let’s consider the Men’s 4×100 Medley Relay from Indy and Naples as an example. In Indy, the Cali Condors A relay team, made up of Mitch Larkin (BK), Nic Fink (BR), John Shebat (FL), and Townley Haas (FR), earned 2nd place in the heat and thus earned 14 points in the event. Going into this race, each athlete had a rating of 500. So, their relay’s rating totals to 2000. Based on the previously discussed process for individual events, which applies similarly here, imagine that they earned 4,920 as a group. Since each athlete has an equal rating representing $\frac{1}{4}$ of their total relay’s rating, this will be distributed equally amongst all four members. Each athlete would receive 1,230.
Going into the match in Naples one week later, Cali’s A relay was made up of a slightly different group of athletes, namely, Mitch Larkin (BK), Nic Fink (BR), Caeleb Dressel (FL), and Becker Bowe (FR). This time, finishing 3rd place, they would receive a total of 4,280, which is then distributed proportionally to each
by the factor $\left( \dfrac{1}{16} + \dfrac{3}{4}\cdot \dfrac{R^A_i}{R^R} \right)$, as shown in the following table.

If we consider Mitch Larkin’s rating for example, $R_1 = 573$ and the total, $R^R = 2096$, we’d have
\begin{align*}
\left( \dfrac{1}{16} + \dfrac{3}{4}\cdot \dfrac{R^A_1}{R^R} \right) (4280) = \left( \dfrac{1}{16} + \dfrac{3}{4}\cdot \dfrac{573}{2096} \right) (4280) \approx 1145.
\end{align*}
Since Caeleb Dressel didn’t participate in this race in the previous match, his rating was only 475 going into Naples. This is less than Larkin’s and so he’ll receive a lesser portion of the value. He would have
\begin{align*}
\left( \dfrac{1}{16} + \dfrac{3}{4}\cdot \dfrac{R^A_1}{R^R} \right) (4280) = \left( \dfrac{1}{16} + \dfrac{3}{4}\cdot \dfrac{475}{2096} \right) (4280) \approx 995.
\end{align*}
This would follow similarly for all athletes participating.
For any given match, this sums up the process of computing the ratings for each event. This continues for all matches throughout the season exactly as listed above as long as the athletes in the league remain the same. However, since the league will not stay fixed and swimmers will sign to rosters or leave the league periodically, there are a few more things to consider in order to maintain the zero-sum and no-inflation properties, see section 2.6.
-
-
Disqualifications
-
What happens when an athlete gets DQ’d? Let’s consider an individual event, specifically the Women’s 200m Backstroke from Naples in 2019 (it will work identically for relays and skins races), where Margherita Panziera was disqualified. The full results were as follows.

Notice here, Kylie Masse earns fifteen points: nine for finishing first, three from Megan Kingsley, two from Silvia Scalia, and one from Margherita Panziera. Although Margherita’s team is penalized an additional two points for her DQ, the ratings treat this as if she finished last place and missed the jackpot bonus margin, giving up her point to the event winner.
-
-
Roster Changes
-
When a swimmer leaves the league, their rating (relative to the neutral-point of 1000) will be redistributed equally amongst the athletes remaining in the league per formulas (6) and (7). This however, reduces the overall value of the league by 1000. If they are directly replaced by another athlete, and the total number of swimmers on each roster still remains at sixteen for both genders, the new athlete is given a rating of 1000 to make up this difference. However, if there is not a one-to-one replacement, a ”virtual swimmer” will fill this void until a new athlete joins the league. This ”virtual swimmer” will not compete or show up in the ratings, but will exist behind the scenes to mathematically preserve the properties of the rating system. Thus, each team will always have eighteen men and eighteen women (some potentially ”virtual”) and so the total value in the system will stay fixed. (Note: This is eighteen instead of sixteen due to DC Trident’s and NY Breakers’ 2019 rosters – see Section 1.1)
Understanding the $\alpha$ Parameter
With the exception of athletes who miss the jackpot bonus margin, which is intended to penalize athletes for substandard performances, one of the properties the system aims to achieve is the Non-Participant Penalty property. Since the athlete scoring one point in an event is always better than the athletes sitting out and scoring none, it is desirable that the rating system reflect this. Even the eighth-place finisher should end with a better event rating than the non-participant. Whether or not this occurs, is highly dependent on the specific values chosen for the α parameter in equations (1), (2), (3), and (4).
Recall that α itself determines how much of the non-participants’ value is redistributed to the participants. In equation (1), $\left(1000k – \sum R\right)$, for $k = 72$, represents the total value of the non-participants. α is the fraction that goes to the participants, complemented by $(1-\alpha),$ the remaining fraction that returns to the non-participants. If α is too small and not enough value is given to the participants, then it is possible for lower performing participants to earn a lesser rating than the non-participants. So, loosely speaking, α needs to be large enough. On the other hand, if α is too large, then too much value may be taken from the non-participants, increasing the volatility of the system. In other words, the ratings would change much too rapidly. Ideally, we want to determine the value of α that is just large enough to ensure that participant’s ratings are greater than non-participant’s ratings. So, we solve.
Since the lowest number of points that can be earned (jackpot bonus and DQ penalties aside) is one point, we’ll set $P_A = 1$. Also, since a rating of 1000 represents a neutral-point and most competitors will have higher ratings than this after the first match, we’ll work with the assumption that $\sum R \geq 8(1000)$.
Then, for individual events, that gives
\begin{align*}
&\dfrac{1}{37} \cdot \left( \sum_{s=1}^8 R_{i,s} + \alpha \left( 72(1000) – \sum_{s=1}^8 R_{i,s} \right) \right) > (1 – \alpha) \cdot \left( \dfrac{72(1000) – \sum_{s=1}^8 R_{i,s}}{72-8} \right) \\
&\Rightarrow \dfrac{1}{37} \cdot \left( 8000 + \alpha \left( 72,000 – 8000 \right) \right) > (1 – \alpha) \cdot \left( \dfrac{72,000 – 8000}{64} \right) \\
&\Rightarrow \dfrac{1}{37} \cdot \left( 8000 + \alpha \left( 64,000 \right) \right) > (1 – \alpha) \cdot \left( \dfrac{64,000}{64} \right) \\
&\Rightarrow \alpha > \dfrac{29}{101} \approx .287 \\
\end{align*}
It was decided $\alpha = 0.5$ would be sufficient. This was done partly to keep the numbers clean and partly to give some additional leeway to account for the assumption that $\sum R > 8000$.
Performing a comparable analysis from similar assumptions yielded values of $\alpha > \frac{8}{21} \approx 0.38$ for skins events, $\frac{11}{14} \approx 0.78$ for single-gender relays, and $\frac{11}{17} \approx 0.65$ for mixed relays. For skins, $\alpha$ will also be set to $0.5$, as this satisfies the determined lower bound and allows for a consistent value across all non-relay events.
However, this is not exactly the case with the relays.
For relays, it was determined that single-gender events would also have $\alpha = 0.5$, but mixed events would have $\alpha = 0.25$. Notice here, that each of these falls below the lower bound suggested by the analysis above. Though I believe this decision was made to simplify the numbers, it does introduce potential issues. In particular, for these relay events, the system does not meet the Non-Participant Penalty property. That is to say, in many cases, deciding to sit out of an event is more beneficial for an athlete’s rating than participating. For example, this can be seen in the Men’s Medley Relay in Indianapolis. The athletes on DC Trident’s B relay (placing eighth) each received an event rating of 176. Swimmers who did not participate received a rating of 250. This is similar for the mixed relays as well. Athlete’s from the Aqua Centurion’s B relay (placing eighth) in Indianapolis received a rating of 203 compared to non-participants who earned a rating of 375. Thus, in some cases, this may potentially incentivize athletes to opt out of a race to preserve their rating, a characteristic which I would argue is undesirable for a rating system.
As I’ve stated above, no rating system can be perfect. Certain attributes must be sacrificed as others are prioritized. However, little is gained from this choice of $\alpha$ values and thus, in my opinion, such a sacrifice is unnecessary here.
This leaves us with two questions: Does the rating system achieve the criteria it set out to? and Does the system actually reflect performance accurately?
Meeting the Criteria
Does the rating system achieve the criteria it set out to? The simple answer is yes.
Since each event is essentially just taking the total current value in the system and redistributing it based on the match results, the total value in the system stays fixed. This means for one swimmer’s score to go up, others’ must go down. Thus the system satisfies the Zero-Sum property. Likewise, as long as roster sizes stay fixed, this also prevents inflation. If athletes leave the league or certain teams sometimes compete with unfilled rosters, this would upset this balance, but ”virtual swimmers” will fill this gap to maintain the balance as needed.
As discussed above, because swimmers participating within a heat have their value redistributed to their competition, the better they are, the more value available, and thus, competing against better performing athletes will yield larger ratings. This satisfies the Degree of Difficulty property.
Since the system is based purely on how many points earned in the race, the actual times don’t dictate the ratings, only the direct competition does. Thus, this satisfies the Non-Absolute Measurement Property.
For individual and skins events, the $\alpha$ parameter is set to ensure that it is better to place last (with exceptions of missing the jackpot margin or disqualifying) and score one point than to not participate in the event. This ensures the Non-Participant Penalty property for those races. However, it is not set to ensure this for either single-gender or mixed relays and thus does not meet this criteria in those cases. Despite that, the ISL was still satisfied with this.
So, the system meets the criteria valued by the league, bringing us to important question number two.
Effectively Ranking Athletes
Does the rating system actually reflect performance accurately?
Determining whether or not the rankings accurately reflect the performances over a season can be tricky. There is a complex web of variables and rock-paper-scissor-esque paradoxes that can make evaluating this feel too much like an intuitive, gut-based, best guess. If Dressel beats Manadou one week, then Adrian beats Dressel the next, and Manadou beats Adrian the third, who should be ranked the highest, rock, paper, or scissors? (I leave it for you to decide who is rock, paper, and scissors in this analogy). So instead, we fake it.
This means we will construct scenarios that put the system through both obvious and extreme conditions to verify that they have the intended outcome. I have done a variety of different tests like this, but let’s consider one for example here.
Assume the season followed a 14 match schedule as outlined below. This schedule intentionally groups Aqua Centurions with Cali Condors and DC Trident with Energy Standard for six matches a time, then matches them with every other possible combination of teams. The final two matches are when these groups mix. (Note: This specific grouping has a purpose, which I will address shortly.)

Let’s also assume that each team only has two athletes who compete in this imaginary event. Let’s call them, for example, AQ1 and AQ2, CC1 and CC2, DCT1, DCT2, etc. Finally, let’s assume that throughout the simulation, results will be sorted (placed) by the following criteria:
-
Sim-athletes with a one will always place higher than sim-athletes with a two. (i.e. CC1 $>$ CC2, ES1 $>$ ES2, CC1 $>$ ES2, etc.)
-
Once step (1) has been determined, then sim-athletes will be sorted by alphabetical order. (i.e. AC1 $>$ CC1).
For example, the results of the first match would be (1) AC1, (2) CC1, (3) I1, (4) LAC1, (5) AC2, (6) CC2, (7) I2, (8) LAC2. Simulating this across the entire season, we have final rankings and ratings as shown below.

These do, in fact, reflect the expectation. Wait…hold on…do they? If we’re sorting based on alphabetical order, shouldn’t AC1 be the top swimmer? Wouldn’t we expect to see a ranking of (1) AC1, (2) CC1, (3) DC1, (4) ES1, etc.? Well, no.
This may seem counter-intuitive at first, but consider the deliberately unusual schedule structure along with the fact that the Degree of Difficulty principle was prioritized and the Unanimity Principle was sacrificed. The way schedule was built, athletes from Iron, LA Current, London Roar, and NY Breakers, spend six matches competing and accumulating value before DC Trident or Energy Standard are worked into the mix. So, when DC Trident, Energy Standard, Iron and London Roar compete in week seven, that race has a larger total value than the comparable match from week one. Thus, based on the degree of difficulty principle, we should expect that DC and Energy should then accumulate more value than the Centurions and Condors respectively.
Now, you might suggest a fair criticism, that this doesn’t exactly reflect the ranking of the athletes as we initially set from the outset. However, we can note three things. First, their actual rating scores are very close in comparison. DCT1 (15,248) is similar to AC1 (15,016) and ES1 (11,886) is similar to CC1 (11,590), especially relative to ratings like LR2 (2,183) and NYB2 (1,417). Just in the same way a NCAA March Madness seeding of eight vs. nine tells us it will likely be a close probability for either to win, with only a slight edge to the eight seed, we can interpret these ratings similarly here. This is the ultimate purpose of the system after all and it serves it effectively regardless of whether DCT1 or AC1 is actually on top. The point is, they’re really close and we expect their race to reflect this.
Secondly, as is true with all statistical models, they become more accurate when more data is entered. With minimal direct competition between DCT1 and AC1 (specifically just one match in this case), it is likely that this would be rectified (if necessary) after just one additional competition between the two.
Finally, a flaw in the logic of testing this with fake athletes in general, is that in the real world, AC1 likely won’t be unequivocally better than DCT1, and thus may not always win, even if they do the majority of the time. This is part of the fun of sport and why we still need to tune in and watch! There is performance variability! Dressel might be a better swimmer than Manadou, but that does not mean he will best him every single time they go head-to-head. Thus, it is reasonable to consider the ratings with an error of plus or minus a few places depending on the athletes’ specific performance on a given day and enjoy and appreciate that variability, because that is ultimately what makes the sport so exciting in the first place. Anyway, these results certainly live within that reasonable margin of error. Therefore, I would argue this simulation was a success.
Final Thoughts
With a new era of swimming upon us, we’re lucky to live in a time when the sport is more exciting, engaging, and accessible than ever, for both athletes and spectators alike. This new rating system is just another example of how the International Swim League is innovating to push our sport forward. As a self proclaimed swim- and math-nerd (and I’m confident now proclaimed by all of you as well), these types of changes get me really excited about the direction our sport is headed. Whether they’re developing formulas to rate athletes or setting the stage for swimming’s superstars to shine, the ISL’s vision for our sport is proving to be one worth watching.
Yes good idea let’s shit on the swimmers that aren’t as fast as the top 1% by giving them a bad rating, taking points away from them, taking prize money away from them and making them look bad. That was the whole goal of this league anyway right? Or wait? Wasn’t it to close the gap? Or was it to give more money to sjoestrom and co?;)
…or just rank them swimmers in that heat by their best time or season best time. Your average non-mathematician viewer can grasp that way easier.
I am using this for my next Equality in Society seminar .
swimming is already boring enough.. if this is their vision of an “entertaining show”, i predict it’s going to fail pretty badly…
The ISL is slowly getting ruined
Rapidly.
Someone correct me if I’m wrong, but why do we need points to define who the underdog is?
Swimming is not basketball. Skill in basketball cannot be quantified, but in our sport it is clearly shown by times.
If I’m watching the ISL, I know who the underdogs are simply because of best times. When I’m watching the race, I’m not tracking points, for Gods sake.
This is a mess.
I agree with you that this is way too complicated, but the casual fan is not going to know best times or be able to glance over a field and determine the underdogs.
Like the author mentioned for basketball seeds, this rating system is to help the casual fan who has no clue whether Sarah Sjostrom or Katie McLaughlin are better at the 100 fly.
they might get a few casual fans.. but lose real swimming fans.
In a meet where there is only finals and no lane order assigned due to qualification time, the PBs and/or maybe their ranking within the ALREADY EXISTING (and way less complicated) point system according to their PB could simply be shown next to the name on screen.
Swimming is already confusing for the ‘casual’ viewer. Every couple of minutes they get 8 new names, men and women alternating, different strokes with entirely different rules, different distances, different times… and now a second point system nobody understands?
Swimming, at the core, is such a straight forward sport. You dive in and whoever touches the wall first wins. It really doesn’t need a system like this. At all.
oh ffs
I love math. And I give Steven a ton of kudos for his work on this from a quantitative perspective.
And, I also feel compelled to jump in here and voice my vote that this is way too complicated, not only for the average viewer, but also for mathy swim nerds. Quarterback rating, golf handicaps, FedEx Cup points, and even Chess ratings are just a few examples of incredibly simple to understand “rating” methods. In summary, I’m impressed by the math and the thought that went into the criteria, but I think the most important criterion was omitted: simplicity.
I’m not saying throw out the points concept entirely. I actually love the introduction of a ratings system to… Read more »
thanks Dan. You’ve summed up my thoughts exactly.