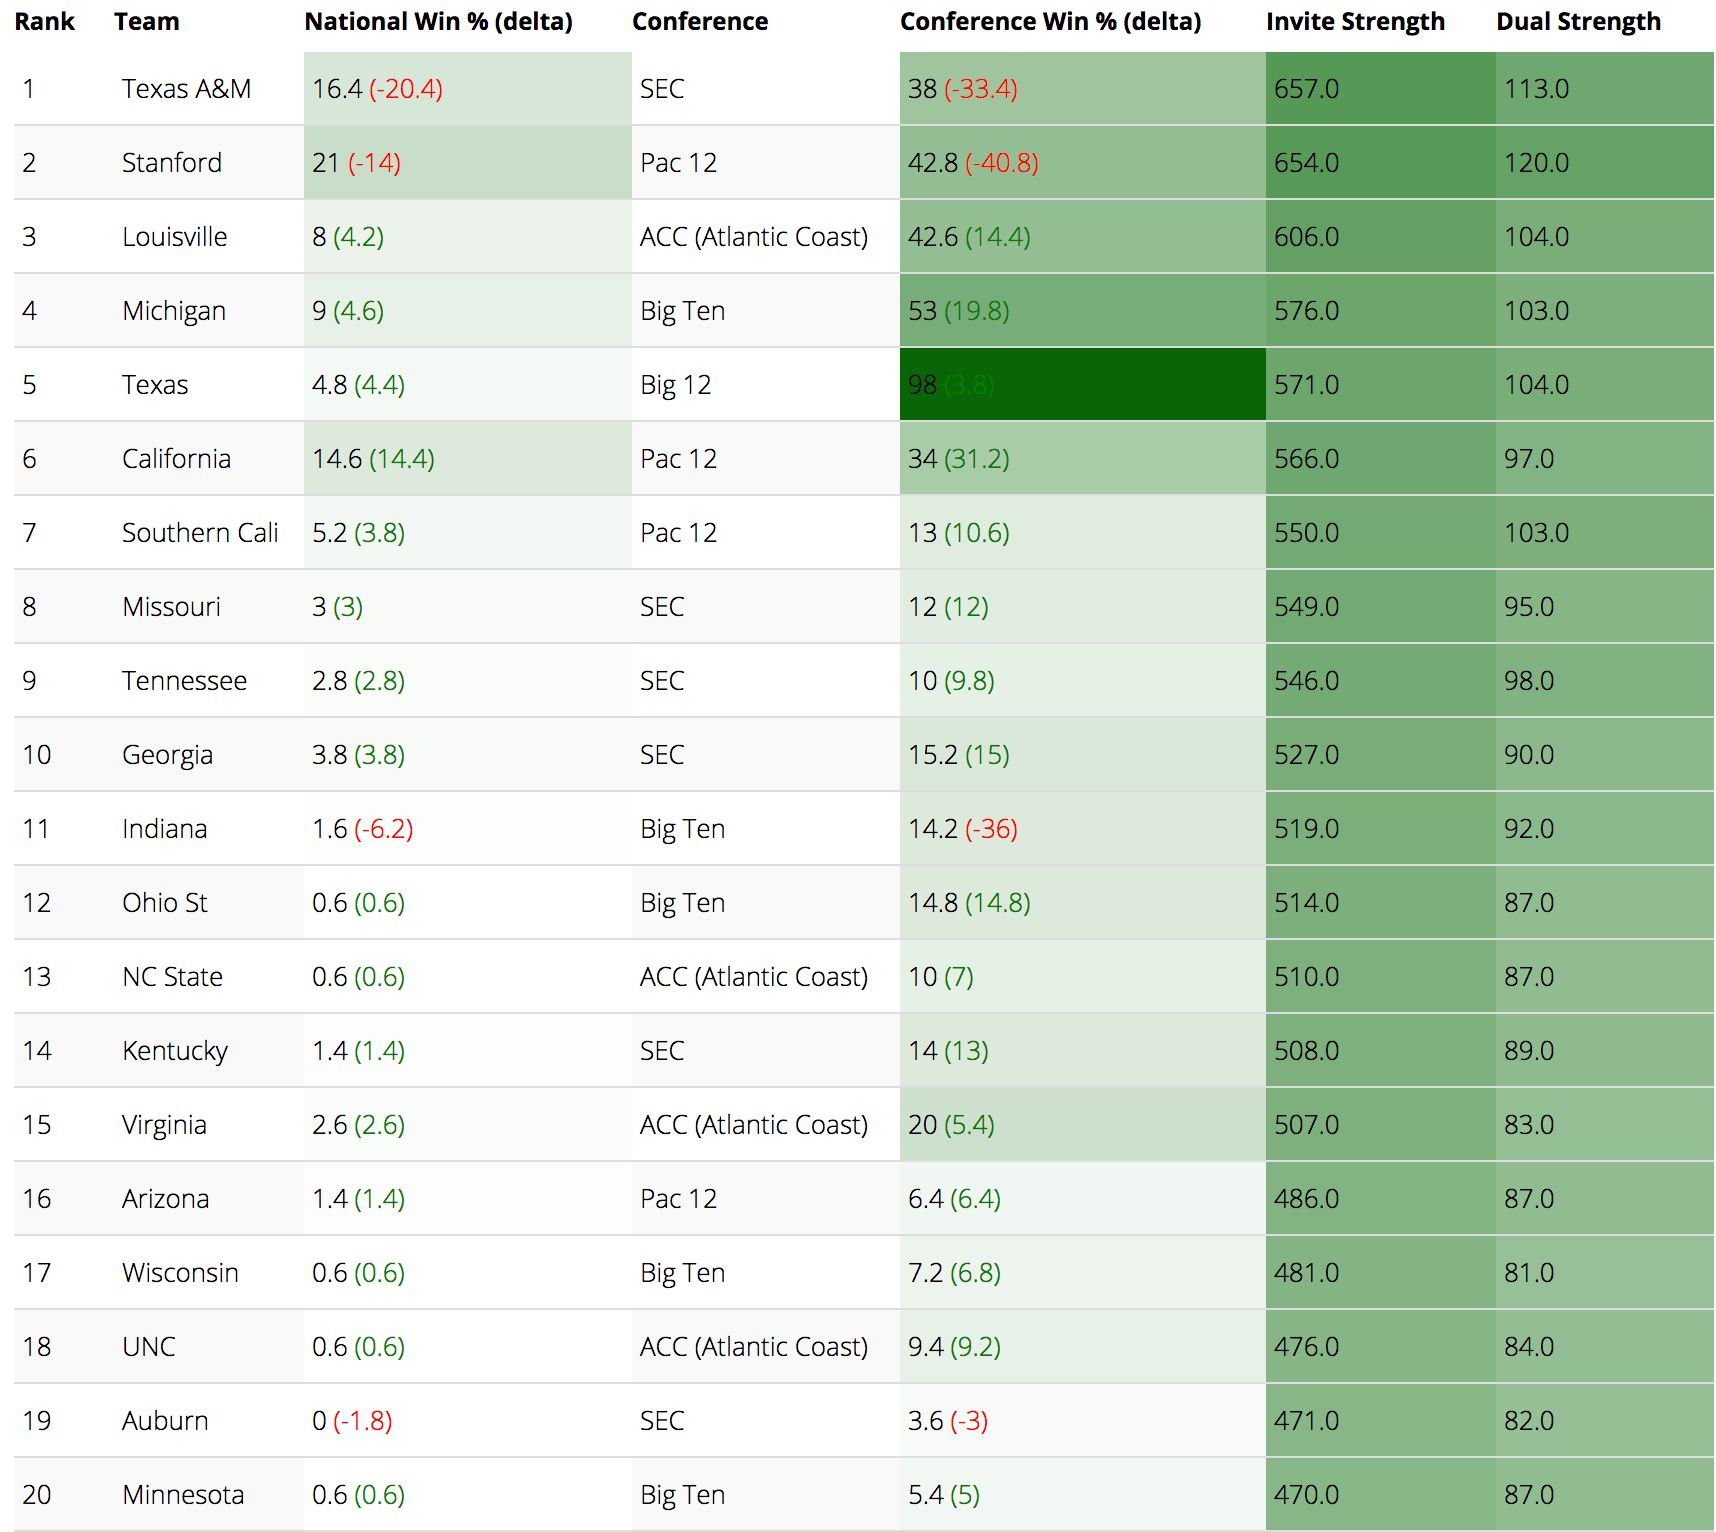
Now that the first half of the NCAA swim season is complete, lets check in and see how the top college teams stack up. Earlier today, we published our simulated nationals through this point in the season. Now, let’s use the Swimulator’s methodology to do some predictions based off of that simulation. We will estimate how likely each team is to win nationals and what the overall team rankings look like.
Here’s a link to the Swimulator to see the full results.
Note that while I believe that most teams have finished their mid-season tapers, not all teams have and so these rankings are likely to fluctuate in the next few weeks as new times are added.
The Swimulator’s team ranking are determined by taking a team’s lineup, and looking at how many points that lineup would score at an average conference meet. It takes the top 10% of all times done in previous years, and sees how each of the team’s swimmers rank amongst those times. Say a time was in the 5th percentile of all times swum in that event. Then it should finish in about the middle of this virtual meet and would score 10 points (20/2). Summing the scores of all the individual swims gives us the overall team score. Scores are discounted if your teammates are excepted to beat that time.
To find the nationals win percentages, I simulate a nationals meet using the top times swum so far this year, automatically selecting three events for each swimmer. I then do what’s called a Monte-Carlo simulation on that data. I add some noise to each time and tapered the swimmers using the team’s average taper percentage from previous years. By simulating this same meet over and over, I then looked at the average number of wins for each team. The total number of wins divided by the number of simulations gives us each team’s likelihood of a national championship.
Rankings for the Women

D1 women’s top 20 rankings by the swimulator
And for the Men

Men’s D1 top 20 rankings 12/7
The rankings will be updated throughout the season, so watch how they change as we get closer to the end of the year! If you head to the site, we also have rankings for DII and DIII teams.

Who are these posts for? It’s all talk. We only know results after NCAAs, until then all these prediction posts are rat poison.
The standard deviation adjustment when applied to corollary and binary vistatudes will not codify to statistical norms. This is my opinion backed by nominal petuscianary adjustments for water density at 72 degrees.
I sell Monte Carlo simulation software, so it’s terrific to read about ways the technique can be applied. You wrote “The total {average} number of wins divided by the number of simulations gives us each team’s likelihood of a national championship.” The average is often very close to the 50th percentile of probability, so the figures you posted are essentially still an over/under coin flip for wins. The power of Monte Carlo simulation is that it allows us to peer beyond the average. I’d like to see a the 60th or 70th or 80th percentile probability of wins as well as the 20th, 30th, and 40th . . . to compare to the average. I’d also like to understand what… Read more »
Thanks! Good point about the full distribution of simulations. I don’t have a way to display that now but I’ll post again if that changes!
The only factors I take into account in the simulation are the individual swimmer’s variability, the team’s variability, and the team’s historical taper. The model is most sensitive to the team’s taper schedules, so it tends to change a bunch week by week. For example Texas, the defending national champions on the men’s side didn’t show up in the top 10 until last week since they hadn’t rested as much as other school yet. I try to take into account historical tapering, but it hard since schedules change year-to-year.