
This article was originally written in 2017 and published in the 2017-18 College Preview Issue of SwimSwam Magazine.
When the University of Texas faces the University of California, it isn’t a face-off between the best swimmers in Texas and in California. Despite those school’s locations in two of the best recruiting states in the country, fewer than half the men’s teams from both those schools are composed of in-state athletes. Only 15 of the 36, or 42 percent, of athletes listed on Texas’ roster last season hailed from Texas, and 15 of 32, or 47 percent, of Cal’s roster are from California.
To get a look at where Division I swimmers and divers come from, I grabbed the rosters for every team for the 2016-17 season from their websites. Not every athlete has a home state or town listed, so those athletes were excluded from this analysis. That left 8,694 athletes — 5,214 women and 3,480 men.
It may seem like an advantage that Cal and Texas are able to recruit so heavily outside their home regions. According to Collegexpress.com, at 76 percent of US public universities, 80 percent or more of the student body is in-state.
However, those numbers don’t hold for swim teams. Only 29 percent of all DI swimmers and divers compete for a school in the state they are from — 33 percent at public schools and 21 percent at private schools — and only 3 percent of DI teams are composed of 80 percent or more in-state athletes. The over 40 percent of home-state athletes at both Cal and Texas places each well above average for a DI team.
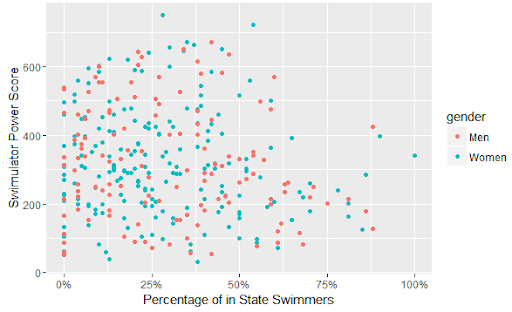
Does that mean it’s an advantage to have a higher percentage of in-state recruits? Actually, no. It turns out there’s no correlation between a team’s quality and its number of in state athletes. I arranged schools by their proportion of in-state swimmers and divers versus their Swimulator Power Score* and, as shown in Figure 1, there is no obvious link.
While Cal and Texas succeeded with higher in-state numbers, the men’s teams at NC State (21 percent), Indiana (22 percent), and Louisville (14 percent) were all ranked in the top 10 with lower in-state numbers. It’s worth noting that no elite team has more than 65 percent in-state athletes.
If we limit the data to Power Five conferences (Big 10, Big 12, ACC, SEC, Pac-12), the same thing remains true. The plot looks about the same as if everything below 400 power points in Figure 1 were cut off, so this isn’t a case of lesser teams muddying the stories of top teams.
Among top-20 teams, the highest in-state percentages belonged to the Georgia men, with 60 percent, and the Cal women, with 54 percent. The lowest in-state percentages among top-20 teams belonged to the Missouri women, with 4 percent, and the Notre Dame men, with no in-state swimmers.
Figure 1
Eleven percent of DI swimmers and divers hail from 88 foreign countries. By far, the most came from Canada, with 139 athletes. The next four were the United Kingdom (76), Australia (51), Germany (49), and Sweden (37). Twenty-four foreign countries had at least 10 athletes, and 27 countries had only one athlete.
The remaining 89 percent of DI swimmers are from the USA. Of those, 32 percent compete in their home state, 21 percent compete for a school that neighbors the state they’re from, and 47 percent travel across more than one state to go to school.
Swimmers and divers from the Lower 48 go to school an average of 611 miles, or 9.2 driving hours, from their hometowns. Elite-academic private schools and Western schools tended to have athletes from farthest away. The top seven schools by average distance from their athletes’ hometowns (men and women) were private. Stanford’s swimmers and divers were from farthest away — an average of 1,577 miles from home, or 23 driving hours. Next were Dartmouth, with 1,292 miles (19.6 hours), and Yale, with 1,256 miles (18.6 hours). The top public school was Arizona, with an average of 1,173 miles (17.5 hours).
The schools with the most local athletes were mostly smaller schools in states east of the Mississippi River. The lowest average distance from home belonged to Central Connecticut State, with an average of 105 miles (1.7 hours).
Figure 2
Origins of Pac-12 Swimmers and Divers (Who Are from the Lower 48)
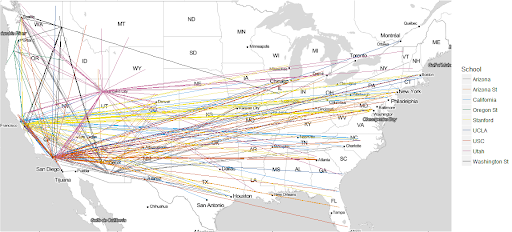
More athletes came from California (839) than any other state. The closest were New York (487), Illinois and Pennsylvania (452 each), and Texas (395). Mississippi had the fewest D1 athletes, with six. The next schools with the fewest were West Virginia and Montana, each with 11.
With only 53 percent of American swimmers and divers going to school in their home state or a neighboring state, it’s clear that recruiting is national for pretty much everyone in Division I. So the next time that big local recruit turns down your favorite state school for another program halfway across the country, don’t be surprised — that’s the typical outcome. Instead, be happy that swimming and diving allows athletes a much wider choice of schools than is available to most people.
DI Men Power Five Conferences
| Roster Size | % In-State Swimmers | % Foreign Swimmers | Avg. Miles from Home | Power Score | ||
| Texas | Big 12 | 36 | 42% | 6% | 818 | 671 |
| Florida | SEC | 35 | 34% | 23% | 738 | 652 |
| NC State | ACC | 29 | 21% | 21% | 682 | 642 |
| California | Pac-12 | 32 | 47% | 16% | 1774 | 636 |
| Indiana | Big 10 | 32 | 22% | 19% | 471 | 628 |
| Stanford | Pac-12 | 26 | 38% | 4% | 1446 | 616 |
| Michigan | Big 10 | 33 | 21% | 9% | 769 | 604 |
| Louisville | ACC | 64 | 14% | 17% | 635 | 601 |
| USC | Pac-12 | 29 | 45% | 7% | 1038 | 583 |
| Ohio State | Big 10 | 51 | 39% | 6% | 495 | 579 |
| Alabama | SEC | 33 | 27% | 30% | 557 | 570 |
| Georgia | SEC | 30 | 60% | 10% | 378 | 570 |
| Auburn | SEC | 34 | 9% | 26% | 788 | 569 |
| Missouri | SEC | 31 | 10% | 16% | 539 | 554 |
| Arizona | Pac 12 | 26 | 12% | 15% | 1172 | 554 |
| Arizona State | Pac-12 | 32 | 13% | 22% | 1049 | 554 |
| Notre Dame | ACC | 32 | 0% | 9% | 853 | 538 |
| Virginia | ACC | 27 | 33% | 7% | 446 | 527 |
| Wisconsin | Big 10 | 27 | 7% | 19% | 942 | 526 |
| South Carolina | SEC | 25 | 20% | 16% | 644 | 511 |
| Minnesota | Big 10 | 33 | 15% | 18% | 783 | 507 |
| Tennessee | SEC | 27 | 26% | 26% | 452 | 507 |
| Virginia Tech | ACC | 27 | 56% | 11% | 446 | 499 |
| North Carolina | ACC | 30 | 27% | 13% | 588 | 490 |
| Texas A&M | SEC | 27 | 59% | 26% | 544 | 475 |
| Florida State | ACC | 26 | 38% | 31% | 787 | 471 |
| Kentucky | SEC | 30 | 7% | 13% | 703 | 470 |
| Duke | ACC | 28 | 0% | 18% | 1521 | 465 |
| LSU | SEC | 25 | 4% | 28% | 918 | 461 |
| Georgia Tech | ACC | 31 | 26% | 19% | 564 | 457 |
| Utah | Pac-12 | 32 | 6% | 25% | 790 | 448 |
| Purdue | Big 10 | 38 | 42% | 8% | 592 | 446 |
| Penn State | Big 10 | 24 | 38% | 21% | 424 | 432 |
| Iowa | Big 10 | 30 | 33% | 10% | 441 | 404 |
| Pitt | ACC | 24 | 38% | 17% | 567 | 401 |
| Michigan State | Big 10 | 27 | 22% | 7% | 456 | 353 |
| Northwestern | Big 10 | 17 | 6% | 6% | 1126 | 339 |
| West Virginia | Big 12 | 31 | 16% | 6% | 522 | 331 |
| TCU | Big 12 | 31 | 45% | 10% | 691 | 310 |
| Boston College | ACC | 45 | 4% | 4% | 1062 | 222 |
| Miami (Florida) (divers-only team) | ACC | 2 | 0% | 50% | 1166 | 0 |
DI Women Power 5 Conferences
| Roster Size | % In-State Swimmers | % Foreign Swimmers | Avg. Miles from Home | Power Score | ||
| Stanford | Pac-12 | 25 | 28% | 0% | 1702 | 750 |
| California | Pac-12 | 26 | 54% | 12% | 1924 | 723 |
| Georgia | SEC | 31 | 35% | 16% | 488 | 670 |
| Texas A&M | SEC | 35 | 37% | 26% | 797 | 664 |
| Texas | Big 12 | 27 | 30% | 4% | 988 | 655 |
| USC | Pac-12 | 29 | 45% | 7% | 944 | 652 |
| NC State | ACC | 29 | 34% | 17% | 496 | 646 |
| Michigan | Big 10 | 29 | 24% | 28% | 892 | 640 |
| Virginia | ACC | 30 | 13% | 7% | 485 | 624 |
| Louisville | ACC | 34 | 18% | 12% | 494 | 620 |
| North Carolina | ACC | 30 | 10% | 0% | 581 | 602 |
| Wisconsin | Big 10 | 27 | 30% | 4% | 744 | 600 |
| Arizona | Pac-12 | 27 | 7% | 15% | 1175 | 596 |
| Indiana | Big 10 | 20 | 20% | 15% | 750 | 589 |
| Kentucky | SEC | 32 | 22% | 0% | 353 | 587 |
| Minnesota | Big 10 | 38 | 42% | 8% | 544 | 586 |
| Tennessee | SEC | 29 | 10% | 10% | 656 | 584 |
| UCLA | Pac-12 | 38 | 53% | 13% | 883 | 560 |
| Missouri | SEC | 27 | 4% | 11% | 650 | 559 |
| Auburn | SEC | 30 | 7% | 27% | 757 | 552 |
| Ohio State | Big 10 | 31 | 39% | 26% | 372 | 543 |
| Notre Dame | ACC | 29 | 3% | 3% | 719 | 518 |
| Florida | SEC | 28 | 50% | 29% | 484 | 515 |
| Virginia Tech | ACC | 31 | 39% | 19% | 400 | 515 |
| Purdue | Big 10 | 37 | 59% | 8% | 226 | 500 |
| Duke | ACC | 31 | 13% | 6% | 907 | 498 |
| Alabama | SEC | 33 | 0% | 12% | 677 | 497 |
| Florida State | ACC | 28 | 39% | 21% | 676 | 487 |
| LSU | SEC | 32 | 19% | 16% | 1139 | 479 |
| Arizona State | Pac-12 | 21 | 14% | 24% | 863 | 461 |
| Penn State | Big 10 | 27 | 44% | 0% | 377 | 460 |
| Northwestern | Big 10 | 32 | 6% | 6% | 1051 | 454 |
| Arkansas | SEC | 28 | 11% | 21% | 623 | 454 |
| South Carolina | SEC | 41 | 5% | 7% | 704 | 448 |
| Georgia Tech | ACC | 33 | 42% | 15% | 552 | 433 |
| Pitt | ACC | 29 | 31% | 14% | 425 | 425 |
| Nebraska | Big 10 | 27 | 26% | 7% | 503 | 424 |
| Utah | Pac-12 | 34 | 24% | 9% | 789 | 419 |
| Kansas | Big 12 | 30 | 13% | 7% | 563 | 412 |
| Iowa | Big 10 | 30 | 27% | 7% | 302 | 405 |
| Rutgers | Big 10 | 24 | 21% | 29% | 422 | 376 |
| Washington State | Pac-12 | 19 | 21% | 11% | 852 | 375 |
| Miami (Florida) | ACC | 21 | 29% | 38% | 884 | 351 |
| West Virginia | Big 12 | 23 | 13% | 22% | 482 | 338 |
| Iowa State | Big 12 | 29 | 28% | 17% | 291 | 338 |
| Illinois | Big 10 | 29 | 52% | 10% | 378 | 332 |
| Vanderbilt | SEC | 24 | 0% | 0% | 767 | 309 |
| TCU | Big 12 | 31 | 32% | 0% | 720 | 308 |
| Michigan State | Big 10 | 30 | 43% | 0% | 440 | 302 |
| Oregon State | Pac-12 | 22 | 45% | 18% | 491 | 253 |
| Boston College | ACC | 47 | 9% | 0% | 725 | 172 |
*Swimulator Power Scores are SwimSwam’s data-based team ranking system. The scores are calculated by looking at the top 17 swimmers on each team and giving them points based on the quality of their times in their best three events. These rankings do a pretty good job of mirroring the actual finish order at championship meets. Their biggest flaw is that they don’t include diving.
It’s certainly a telling story that my team went from 75% in-state to less than 50% in about 5 years… and also started breaking a bunch of school records in the process.
Swimming is truly a national sport in recruiting.
Part of that, I think, is driven by the fact that many of the really good swimming programs are not located in the states with the most/best swimmers, and many states with lots of really good young swimmers don’t have big POwer 5 swim programs to pull in those swimmers.
Colorado is a good example. Tons of really good junior swimmers, and some solid mid-major programs, but the state’s flagship institution, University of Colorado, doesn’t have swimming. Denver and Colorado State and a few others are doing good things, but Missy Franklin was never going to stay in-state to go to those programs.
It’s even bleaker on the men’s side. Texas,… Read more »
including international athletes… since 1936? I might consider taking the over, especially including some old programs no longer in existence.