2025 NCAA Division I Women’s Swimming and Diving Championships
- March 19-22, 2025
- Weyerhaeuser King County Aquatics Center — Federal Way, Washington
- Short Course Yards (25 yards)
- Meet Central
- Official Psych Sheets
- SwimSwam Preview Index
- Live Results
- Full Results (PDF)
Prior to the kick-off of NCAAs last Wednesday we put together a model to try to predict the times required to make the finals, and it turned out that the model did a pretty good job. Positive differences here indicate that we predicted times slower than the actual time, and negative indicate faster predictions than the actual time.
| Event | 8th | Predicted 8th | Difference | % Difference |
| 50 free | 21.63 | 21.74 | 0.11 | 0.05% |
| 100 free | 47.37 | 47.48 | 0.11 | 0.23% |
| 200 free | 1:43.24 | 1:43.07 | -0.17 | -0.16% |
| 500 free | 4:37.01 | 4:35.07 | -1.94 | -0.70% |
| 1650 free | 15:52.06 | 15:53.24 | 1.18 | 0.12% |
| 100 backstroke | 50.29 | 50.63 | 0.34 | 0.67% |
| 200 backstroke | 1:50.55 | 1:50.84 | 0.29 | 0.26% |
| 100 breaststroke | 58.30 | 58.40 | 0.10 | 0.17% |
| 200 breaststroke | 2:07.60 | 2:07.76 | 0.16 | 0.12% |
| 100 butterfly | 51.02 | 51.26 | 0.24 | 0.46% |
| 200 butterfly | 1:52.91 | 1:52.87 | -0.04 | -0.03% |
| 200 IM | 1:53.72 | 1:53.85 | 0.13 | 0.11% |
| 400 IM | 4:04.85 | 4:05.86 | 1.01 | 0.41% |
| Event | 16th | Predicted 16th | Difference | % Difference |
| 50 free | 21.89 | 21.90 | 0.01 | 0.04% |
| 100 free | 47.88 | 47.81 | -0.07 | -0.14% |
| 200 free | 1:44.18 | 1:44.46 | 0.28 | 0.26% |
| 500 free | 4:38.76 | 4:37.02 | -1.74 | -0.62% |
| 1650 free | 15:57.60 | 16:00.81 | 3.21 | 0.33% |
| 100 backstroke | 51.20 | 51.20 | 0.00 | 0% |
| 200 backstroke | 1:51.75 | 1:52.20 | 0.45 | 0.4% |
| 100 breaststroke | 58.93 | 59.09 | 0.16 | 0.27% |
| 200 breaststroke | 2:08.56 | 2:08.78 | 0.22 | 0.17% |
| 100 butterfly | 51.35 | 51.70 | 0.35 | 0.67% |
| 200 butterfly | 1:54.16 | 1:54.75 | 0.59 | 0.51% |
| 200 IM | 1:55.50 | 1:55.33 | -0.17 | -0.14% |
| 400 IM | 4:07.29 | 4:08.08 | 0.79 | 0.31% |
There was a fair difference between the actual/prediction differences for 8th and 16th, with the ‘A’ final cut off predictions being better on average. We’ll see why a little later on.
| 8th | 16th | |
| Median Difference | 0.12% | 0.26% |
500 free
With how quick this event had been this season, it was a bit of a shock that the times required to final were almost identical to last year. The 8th seed in 2024 was Abby McCulloh with a 4:37.18 – this year it was Julie Brousseau in 4:34.59, and McCulloh’s time would have entered her only 18th.
A faster psych sheet should indicate a faster set of results. This is the premise that the model is based on, and can be a reductive one. However, the 500 was the only event consistently predicted to be faster by the model – there was something here that the model was not able to pick up on.
100 butterfly
The 100 fly was the other way around from the 500 free. We predicted the event to be slower at both positions (and in general) by not much less than we’d predicted the 500 to be faster.
The psych sheet times were a little slower this year, but the times to final were almost identical – it took 51.07 and 51.34 last year. There was a big change with the 100 fly scheduling this year however, as it has swapped with the 400IM and is now the first event on Day 3. This makes it a little easier for those with doubles, and may explain the uptick.
100 backstroke
This is only with regards to the ‘A’ final time – we were bang on with the 16th place finisher. The time for 8th however was absolutely rapid. It was two tenths quicker than the 8th seed, and a full seven tenths under the time required last year.
We saw Miranda Grana’s 1:48 in the 200 backstroke ‘B’ final, but the speed of the 100 prelims was the bigger shock. Four of the top five returning swimmers from last year only made the ‘B’ final, and only two of those would have made the ‘A’ final this year with their 2024 time.
So it looks like the difference here was an event getting significantly faster, rather than a limitation of the model – certainly not an unwelcome development.
How Accurate Were We Overall?
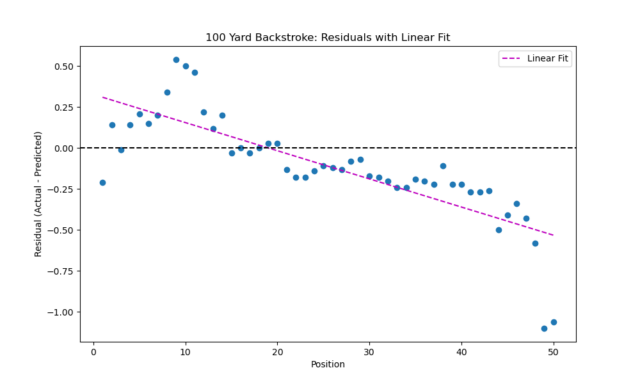
The model didn’t just predict the two positions for each event that we’ve looked at here. We used it to predict the top 50, and we’d like to see how good it was across the board. To do so, we’ll take a look at something called the residuals.
The residuals are the difference between a prediction and an actual value for a given ‘x’ value (in our case the ‘x’ value is the position). In a good model these will be randomly distributed – what a statistician might call ‘noise’.
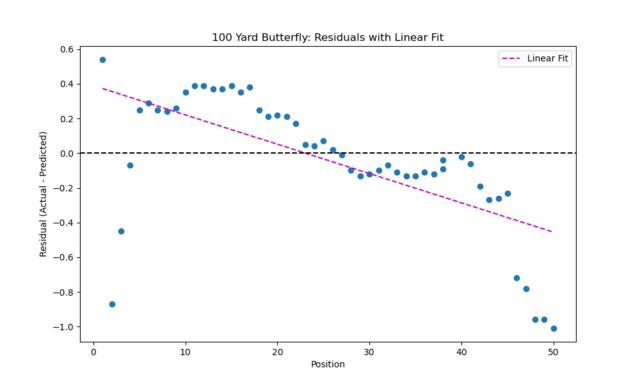
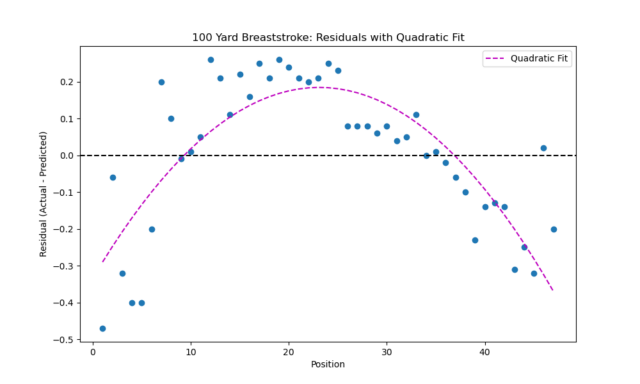
If there is a pattern in the residuals, say something like the following, there’s likely something in the data that isn’t taken into account in the model. We’ve got residuals for four of the events here, showing two different types of patterns in the residuals between them.
100 backstroke
100 fly
100 breaststroke
500 freestyle
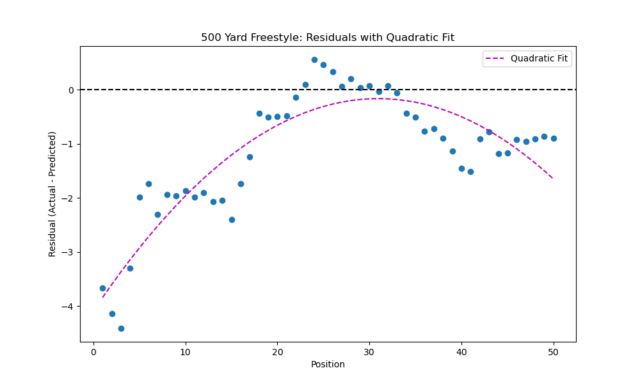
Each of the other events has a similar pattern to one of these, indicating that there is something in the data not accounted for, and does explain why we seemed to have faster predictions at lower positions. Even so, the model was pretty accurate. The goodness of fit values were above 0.9 for almost every event, and none of the residuals were particularly big – most were within 3-tenths of a percent.
For those of you interested in the data, you can see the dataset at the google sheet here. You may notice that a cubic fit for the residuals does appear to give a closer fit than either linear or quadratic, but it seems not by enough to make up for the complexity it introduces.
Were the 8th and 16th place times from prelims or finals? I’d think you’d want prelims, cause lot of people make the A/B, and then are gassed, which would throw off your data.
You have once again completely ignored diving. If we are going to predict diving results I think we should review our method because the method of just using the zone scores to predict is flawed because each zone is scored to provide similar scores from zone to zone but the talent is vastly different from zone to zone. I think we need to examine the scores from the previous years NCAA and factor in a multiplier depending on the strength of the zone the previous year. Feel free to disagree. Also it is different in the men’s and women’s.
http://www.divedove.com should have the content you’re looking for.
4IM was notably faster. If you look at the results, swimmers up to 19th were well below the expected cut time.
I was told there would be no math involved.
I thought UVA had 2026 locked up for 6th straight championship, but now I’m not so sure.