
‘Don’t get too excited about a fast time in October. Don’t get too down about a slow time in October.’
These are popular sentiments among swimmers, coaches, and swim fans. October is a month most teams do some of their heaviest training. This means that times done in meets this time of year are done by very tired swimmers. The thinking goes that this makes October times a bad predictor of end of season times.
The contrarian point of view would say, ‘all October times by all swimmers in all years are tired.’
It should be a positive to swim faster tired than you have in the past. If a swimmer is much faster or slower in October than in the past can’t we say at least a little about their future performance?
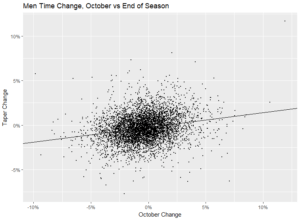
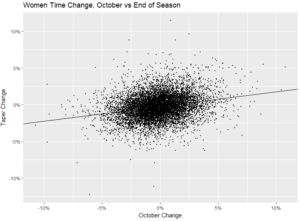
The short answer is yes. Fast/slow October times are correlated with fast/slow taper times at the end of the season. It’s not an extremely strong correlation, but we can learn something about what to expect in championship season.
The long answer: I grabbed times from the last 5 years (2014-2018) for NCAA D1 swimmers. Then I compared their times in consecutive years done at their conference meet or nationals (taper meets). In those same events, I compared their best times in the month of October in both years. For example, Will Licon of Texas went a 2:00.01 200 breast in October 2013 and a 1:57.11 200 breast in October 2014, and improvement of 2.4%. At nationals in 2014 he went 1:53.44 and at nationals in 2015 he went 1:49.48, an improvement of 3.5%.
There were 7787 men that had a time in a specific event at taper meet and in October in consecutive years and 9221 women. The data set didn’t include high school or club times, so this is a comparison of sophomores, juniors and seniors to themselves the previous season.
Regression Output
(all regression coefficients mentioned from here on out are statistically significant p<.0001)
| Men | Women | |
| Constant | -0.0024 | -0.0020 |
| October Change | 0.173 | 0.19 |
| Data Points | 7787 | 9221 |
| R^2 | 0.052 | 0.053 |
A 1% improvement in October time is associated with a .19% improvement in a swimmer’s tapered time in the same event for women and .17% for men. This method explains about 5% of the time change we see in tapered times for men and women. That’s not a lot, but it’s also not nothing.
Instead of trying to capture exact time change, a simpler approach is to look at the chances a swimmer improves at all. Given how much slower/faster a swimmer was in October vs the previous October how often did they drop any amount of time at the end of the season?
Swimmers who were between 2% and 3% faster in October dropped time 69% of the time at their taper meet, about one and a half times more often than swimmers who were between 2% and 3% slower in October who were faster only 44% of the time at end of season rest meets(complete data in the table below). The faster someone is in October, the greater the chances they improve at the end of the year.
Interestingly, swimmers who were between 0% and 2% slower in October had a greater than 50% chance to drop time at the end of the year (this is consistent with the negative intercept coefficient from the regression). This seems unlikely to be because they are somehow training better than in years past and are more beaten down. If that were the case, the swimmers who were a little slower in October would out perform swimmers who are a much faster in October, but that is not what is happening.
Also swimmers dropped time in events they swam in October at a higher rate and in greater amounts than in events overall.
How Often Swimmers Were Faster at a Taper Meet vs October Time Change
If that header is unclear, a verbose example: women whose October time was between 4% and 5% faster than their previous year’s October time improved their taper time 78% of the time
| Women | Men | |
| Oct >5% Faster | 73% | 75% |
| Oct between 4% and 5% faster | 78% | 74% |
| Oct between 3% and 4% faster | 70% | 74% |
| Oct between 2% and 3% faster | 70% | 71% |
| Oct between 1% and 2% faster | 65% | 67% |
| Oct between 0% and 1% faster | 60% | 62% |
| Oct between 0 and 1% slower | 54% | 56% |
| Oct between 1 and 2% slower | 51% | 52% |
| Oct between 2 and 3% slower | 43% | 44% |
| Oct between 3 and 4% slower | 41% | 43% |
| Oct between 4 and 5% slower | 36% | 40% |
| Oct >5% Slower | 30% | 38% |
Scatter Plots (negative is the swimmer got faster, positive is slower)
It turns out in season time changes become more predictive of end of season time changes as the season progresses. If we compare the change in a swimmer’s top time in the months of November and December when in season rest meets typically happen the predictive value increases. The amount of end of season change we can explain becomes 8% for men and 9% for women. This is up from 5% for men and women based on October times.
November/December Regression
| Men | Women | |
| Constant | -0.002 | -0.001 |
| Nov/Dec Change | 0.217 | 0.264 |
| Data Points | 12709 | 20446 |
| R^2 | 0.075 | 0.091 |
The improvement continues if we move to January times. Changes in January times can explain about 10% of changes in taper times for men and 14% for women. Additionally, the correlation shown by the how-often-did-the-swimmer-improve counts were stronger in the January data (see table below). Swimmers between 1%-2% slower in January no longer improved more than half of the time at their taper meet. Going really slow still isn’t a death sentence for faster taper times, but it’s clearly better to be a swimmer performing well.
January Regression
| Men | Women | |
| Constant | -0.002 | -0.002 |
| Jan Change | 0.24 | 0.305 |
| Data Points | 9525 | 15664 |
| R^2 | 0.101 | 0.144 |
How Often Swimmers Were Faster at Taper Meet in an Event vs January Time Change
| Women | Men | |
| Jan >5% Faster | 85% | 72% |
| Jan between 4% and 5% faster | 82% | 77% |
| Jan between 3% and 4% faster | 81% | 78% |
| Jan between 2% and 3% faster | 77% | 77% |
| Jan between 1% and 2% faster | 70% | 70% |
| Jan between 0% and 1% faster | 62% | 63% |
| Jan between 0 and 1% slower | 52% | 54% |
| Jan between 1 and 2% slower | 43% | 45% |
| Jan between 2 and 3% slower | 34% | 39% |
| Jan between 3 and 4% slower | 30% | 34% |
| Jan between 4 and 5% slower | 31% | 37% |
| Jan >5% Slower | 25% | 27% |
Using this data to make predictions is never going to be super reliable for an individual swimmer. It’s too volatile. A swimmer can swim terribly all season and perform well at the end of the year, and that’s not an outlier of an outcome. Thinking along the lines of this model may be counter productive to an active swimmer. Putting too much meaning on this type of data is tricky. Instead, this type of analysis is most useful in the aggregate for predicting team wide or meet wide trends.
The conventional wisdom that in season times aren’t that meaningful isn’t totally wrong. We can better predict a swimmers end of season performance by looking only at their previous taper times than looking only at their current year in season times. However, the extreme position that in season times mean absolutely nothing is incorrect. Given a swimmer’s previous in season performances we can infer a little about their chances of improving and by how much.
Notes
-This effect appears to be relatively similar across teams. I tried running these regression on the data for 10 different single teams and they were pretty similar to the data as a whole. There was some variation, but that is to be expected when lowering the sample size from 5000+ to a couple hundred.
-I assume that the stronger correlation in the women’s January data is related to the fact that women’s tapers are smaller than men’s tapers. Women taper a median of 4.4% off their January times and men drop a median of 4.9%. Because women are swimming closer to their end of season times, it makes sense that the variability at the end of the year is less. Though that’s just my theory. Women are also closer than men to their end of season times in October and R^2 is similar for both genders in the October model. I’d be interested to hear other possible explanations in the comments.
Big fan of this kind of statistical analysis!! Please keep it up for future articles – have always felt like other major sports get this level of analysis, so it’s awesome to see this done for swimming
Wow Andrew! Mind blowing detail, well done! Thank you.
Thanks for all your hard work on this! Very interesting! From a Texas angle, not having a meaningful conference meet, does that affect any of
your findings?
Not really. For all the talk in these comments about how Texas is always the exception, for the most part, they are pretty of the middle of the road statistically. The only category they stand out in is how fast they are. They swim slow in season, but not to an extreme degree. Their taper patterns are pretty standard.
As an example, in early January last year, Kevin Hallman was able to predict the points margin between Cal and Texas in the swimming events at last year’s nationals to within 1 point (his error in the final margin was because he didn’t give Texas enough diving points in his guesstimate). He had to get a little lucky to get it… Read more »
Thanks again!
Would also be interesting to see progression of teams which suit/shave in December versus those which suit/shave for conference and plot NCAA times against each scenario.
The problem with that study would be that these days, there are very, very few teams that aren’t rested for their mid-season invites. I think probably after the Lochte 24-month training cycle flopped, that was the last time anybody really thought that the 4 months from late November/early December to NCAAs wasn’t enough for a full training cycle.
There is quite a difference between tapering and resting. I feel like many teams are resting little bit for midseason but not really tapering or shaving.
Just Purdue
When was the Lochte 24-month training cycle? I actually haven’t heard of when he did that
On top of that question… is it more mental or physical why swimmers need shorter training cycles within the larger main cycle? In theory, if you could train for 2 years straight, would you be better prepared physically than those with the smaller built in training cycles?
Yeah what’s the Lochte 24 month cycle? Link to an article about it? He just trained hard for 2 years without tapering?
Super interesting data right there. It’s always hard to tell how an individual swimmer is going to do, but as you mentioned having an estimate of how the team may be performing as an entirely is a pretty valuable thing. I’d be interested if these trends hold true for D2 and D3 as well.