The National Federation of State High School Associations has released its High School Athletics Participation Survey for the 2023-2024 school year. Swimming and diving had a combined 254,973 participants, which slipped around 2,500 from the 2022-2023 school year and marked the fourth-straight survey in which participation had declined.
Note that the data is based on surveys of high school athletics directors, so is not exact.
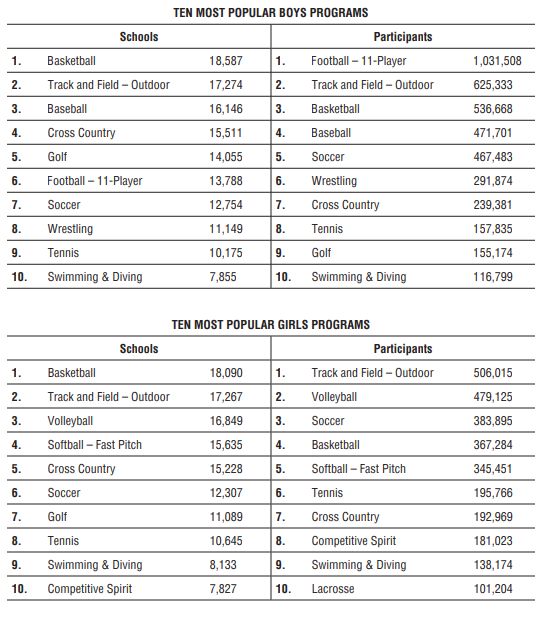
Swimming remained as the 10th-most popular sport for boys by both number of school sponsoring and number of participants and 9th-most popular for girls.
The trend of declining participation in swimming is part of a broader nationwide trend of decreasing participation in high school sports. The decline began before the COVID-19 pandemic but was accelerated in the 2019-2020 and 2020-2021 season. A combination of declining interest in sports generally, and the dominance of club sports is credited with much of that decline, though many sports have begun to recover post-pandemic.
Recent years have also seen a general downward trend in USA Swimming membership.
Many other sports also saw declines, though the notable exception is track & field, which has seen big leaps in each of the last two years and is back above pre-pandemic participation numbers. Soccer, weightlifting, football, and wrestling were also bright spots in the participation numbers.
Water polo saw a small increase as well in the 2023-2024 season.
It’s not all bad news for swimming & diving programs, though: boys swimming actually saw a small uptick from last year (within the margin of surveying error), and both boys’ and girls’ swimming have more participating schools than they did pre-pandemic. Boys swimming schools jumped from 7,704 in 2018-2019 to 7,855 in 2023-2024, while girls jumped from 8,007 to 8,133 in the same time period.
Swimming Participation Change Over Time
| Boys | Girls | Combined |
Percentage Changed (Combined)
|
|
| 2023-2024 | 116,799 | 138,174 | 254,973 | -0.96% |
| 2022-2023 | 116,741 | 140,711 | 257,452 | -5.68% |
| 2021-2022 | 123,208 | 149,751 | 272,959 | -11.87% |
| 2018-2019 | 136,638 | 173,088 | 309,726 | -1.53% |
| 2017-2018 | 138,935 | 175,594 | 314,529 | 1.74% |
| 2016-2017 | 138,364 | 170,797 | 309,161 | 2.98% |
| 2015-2016 | 133,470 | 166,747 | 300,217 | -1.22% |
| 2014-2015 | 137,087 | 166,838 | 303,925 | -0.07% |
| 2013-2014 | 138,373 | 165,779 | 304,152 | 0.66% |
| 2012-2013 | 138,177 | 163,992 | 302,169 | 2.68% |
| 2011-2012 | 133,823 | 160,456 | 294,279 | -0.17% |
| 2010-2011 | 133,900 | 160,881 | 294,781 | 1.72% |
| 2009-2010 | 131,376 | 158,419 | 289,795 |
Overall HS Sports Participation Over Time
| Boys | Girls | Combined |
Percentage Changed (Combined)
|
|
| 2023-2024 | 4,638,785 | 3,423,517 | 8,062,302 | 2.73% |
| 2022-2023 | 4,529,795 | 3,318,184 | 7,847,979 | 3.02% |
| 2021-2022 | 4,376,582 | 3,241,472 | 7,618,054 | -4.02% |
| 2018-2019 | 4,534,758 | 3,402,733 | 7,937,491 | -0.54% |
| 2017-2018 | 4,565,580 | 3,415,306 | 7,980,886 | 0.22% |
| 2016-2017 | 4,563,238 | 3,400,297 | 7,963,535 | 1.24% |
| 2015-2016 | 4,541,959 | 3,324,306 | 7,866,265 | 0.76% |
| 2014-2015 | 4,519,312 | 3,287,735 | 7,807,047 | 0.15% |
| 2013-2014 | 4,527,994 | 3,267,664 | 7,795,658 | 1.06% |
| 2012-2013 | 4,490,854 | 3,222,723 | 7,713,577 | 0.27% |
| 2011-2012 | 4,484,987 | 3,207,533 | 7,692,520 | 0.32% |
| 2010-2011 | 4,494,406 | 3,173,549 | 7,667,955 | 0.52% |
| 2009-2010 | 4,455,740 | 3,172,637 | 7,628,377 |


Does the number of schools sponsoring programs count co-op programs alone for each school or just as one program? I know here in Wisconsin, there are plenty of schools who combine with others to form a bigger team. Could make a difference in the numbers reported.
That’s a good question. As a former WI HS swimmer who’s team formed a co-op my junior season and swam against 2 others in the 90’s I do wonder about how that would count. I would guess it counts for each school since both (or all X) schools do offer swimming to their students and the numbers do say schools not teams. But yeah there are a lot of coop swim teams in WI. Not as many in other sports but I do know of a few gymnastics and track teams. Made it interesting when your swimming team mate because your main rival in track a few weeks later.
Track and Field is easy to do at most high schools than having a pool, or recreational pools near the area like swimming and diving require.
Good point on the pool availability. Are there statistics on the increase or decrease in number of pools?