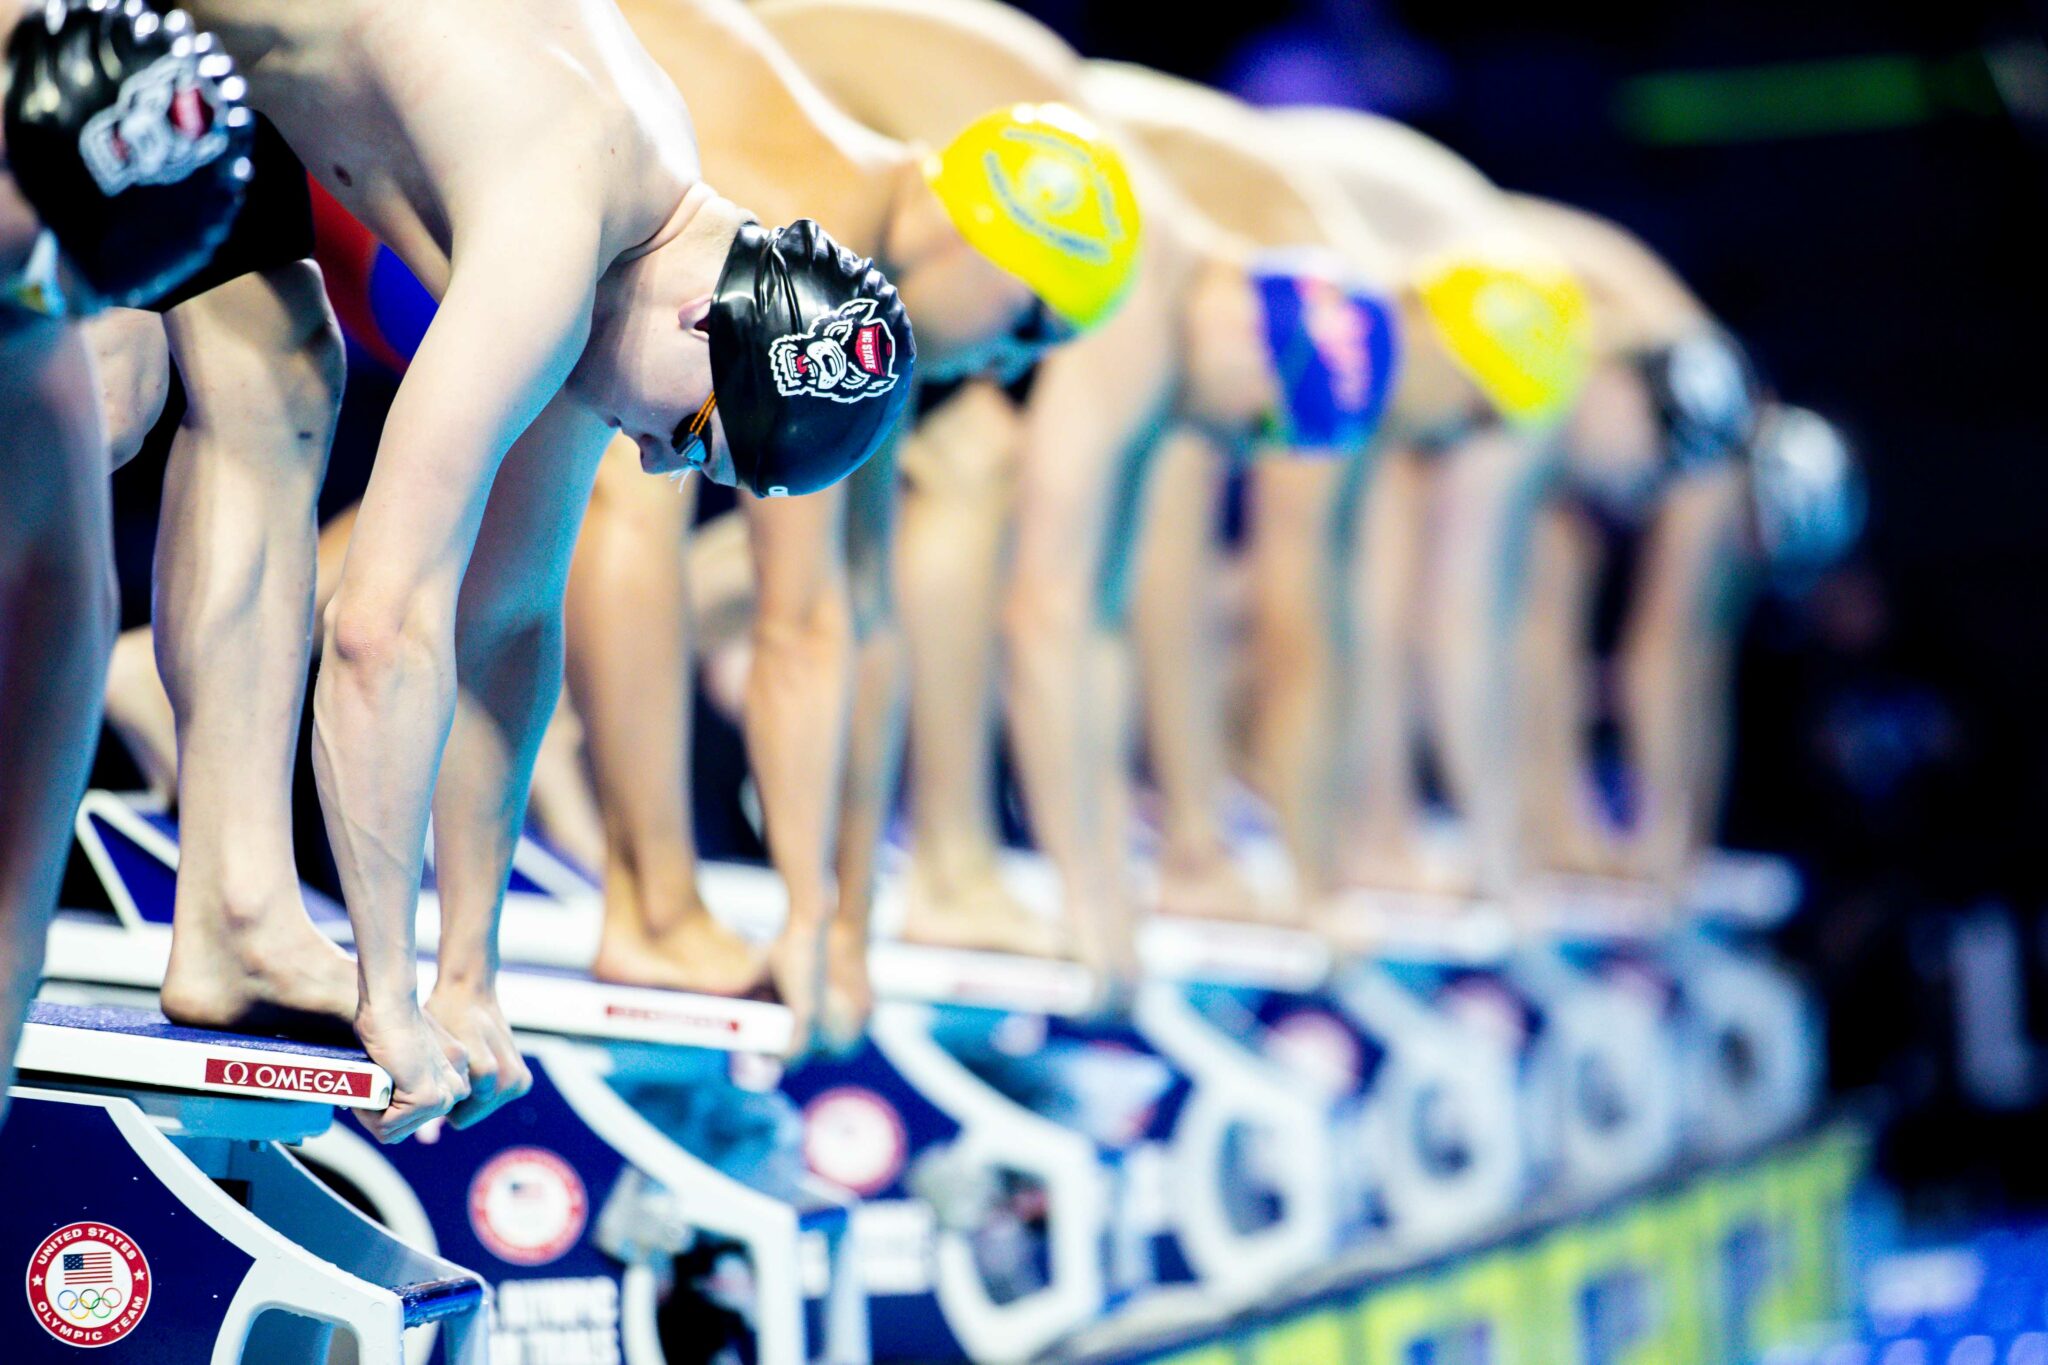
We asked our swimming data partner TritonWear to help us with a deeper insight into performances and what makes elite swimmers fast and where they can improve. This is their TritonWear analysis.
At TritonWear, our mission is to help redefine athlete limits. We continuously strive to educate swim teams, coaches, and athletes on the power of leveraging data in training and competition. We’ve recently released the Focus Progress Graph tool as part of TritonWear Focus.
Focus measures swimming technique and it unlocks after performing 20 laps of each stroke. The app needs a minimum of 5 workouts to build the swimming profile for each stroke type. The Focus progress graph offers great insights into how your technique is changing (are you improving or staying the same). In this article, we’re taking you along on a swimmer’s journey through the data to reveal how you can use it in training to swim faster.

Data Can Reveal How You Compare To Your Competition
On the Focus dashboard, you can toggle between the Myself and Like Me scores for each metric. Every metric correlates to a part of your swimming technique. The Myself comparison shows how you’re improving your technique day to day. The Like Me comparison shows how your skills measure against your competition. It considers swimmers the same speed, height and gender. There is no single person the app uses to compare you with; several users create the model.
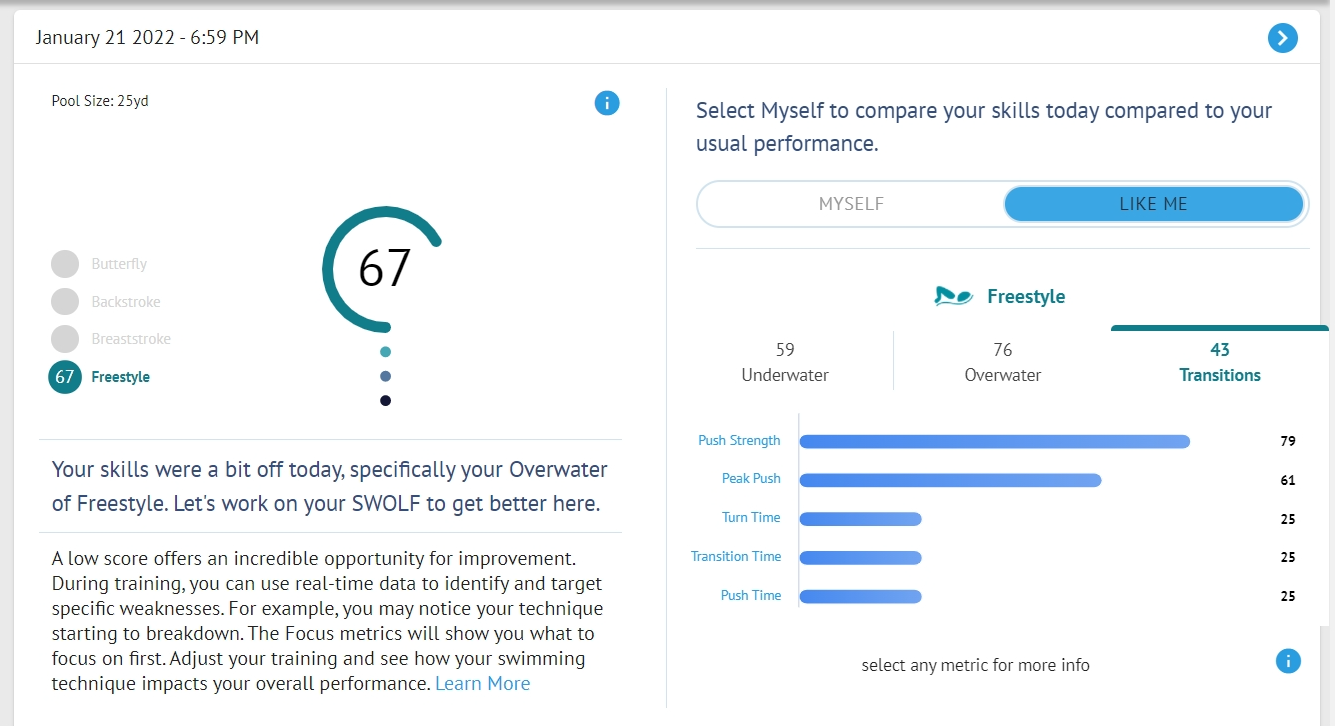
For this analysis, we chose a male freestyle sprinter, training in SCY. In his Focus dashboard above, we can see that he scored a 67 for his Freestyle. This score is a weighted average taken from the three phases of his freestyle swimming: the underwater, overwater (stroke technique), and transitions (turns). For reference, a score of 75 or higher displays a steady improvement in skills, anything under 75 requires attention.
To understand the athlete’s strengths and weaknesses, we’ll explore where he stands against the competition. Looking at his ‘Like Me’, we see that he is excelling in stroking overwater (76/100) but needs to work on his turns (43/100), followed by his underwaters (59/100). Specifically, in the transition phase, a domino effect emerges between his approach, turn, and push off (Transition Time, Turn Time and Push Time).
It seems that a slower turn is contributing to a longer push-off. Naturally, to determine the timing of the turn the first thing to assess is the approach to the wall. The longer Transition Time combined with, the longer Push Time suggests that the swimmer may be closer to the wall than he needs to be.
The Overall Turn
![]()
*Transition Time = the last stroke entry + glide + turn, until the feet land on the wall
Next, by clicking on the Transition Time, we flip the card to see the Focus Progress Graph. This graph illustrates whether the swimmer is getting better at executing the skill or not. Since the goal is faster turns, we want to see the line on the graph for Transition Time trending downwards over time.
How to read the Focus Progress Graph:
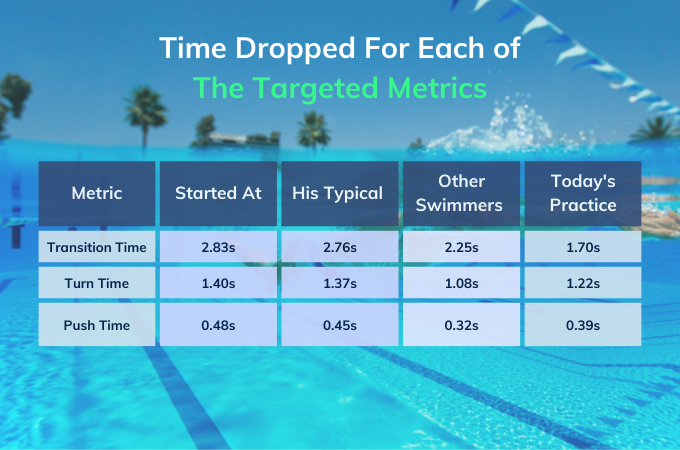
The blue line on the graph shows that the swimmer started at a Transition Time of 3.26s and has since lowered it to an average of 2.76s. That is half a second faster on the turns alone, quite the gain for a sprinter! However, other swimmers like him are averaging at 2.25s, which means there is another half a second to be shaved off there.
Tip: Good transitions begin at the approach. The goal is to lead into the wall fast and translate that speed into the turn and the push-off without compromising form. To do this well, time your strokes coming into the wall and reduce the glide time before initiating the turn.
Learn more on how to fix the approach: Freestyle Flip Turns: Approach
The Turn At The Wall

*Turn Time begins the moment the head starts moving down and until the feet hit the wall.
Similar to his Transition Time, the athlete started with a slower Turn Time (1.62s) but has managed to lower it to an average of 1.37s. He is 0.29s off from other swimmers, his speed and height who are performing the turn in 1.08s.
Tip: Most swimmers slow their Stroke Rate and glide into the wall before the turn, losing valuable momentum and time. Try to hold the Stroke Rate as you near the wall, by kicking harder. During live workouts, use real-time data to check your Stroke Rate.
The Push off The Wall

*Push Time measures the total time from when your feet first hit the wall, until the moment your feet completely leave the wall.
Finally, for his Push Time, the swimmer used to spend 0.49s to spring in and out off the wall on his push-off. However, with targeted work throughout the last couple of months, his time on the wall decreased to 0.45s. To match his competition and improve further, he still needs to shave off an extra 0.13s off his push.
A low push time will translate to faster transitions and more explosive push-offs. The momentum built from the push-off will help set the swimmer up for success on his underwaters.
Tip: Refining Push Time is a combination of improving Push Strength and acceleration (Peak Push ) with optimal form and technique. It further ensures that you move out of your Transition and into your Underwater phase as fast as possible.
To recap, we used the Like Me comparison to benchmark how much faster the athlete needs to get for each skill in and out of the walls. Next, we’ll shift our focus to the athlete’s ‘Myself’ scores to identify how he is performing these three skills day to day.
Data Can Show You If Your Skills Are Improving
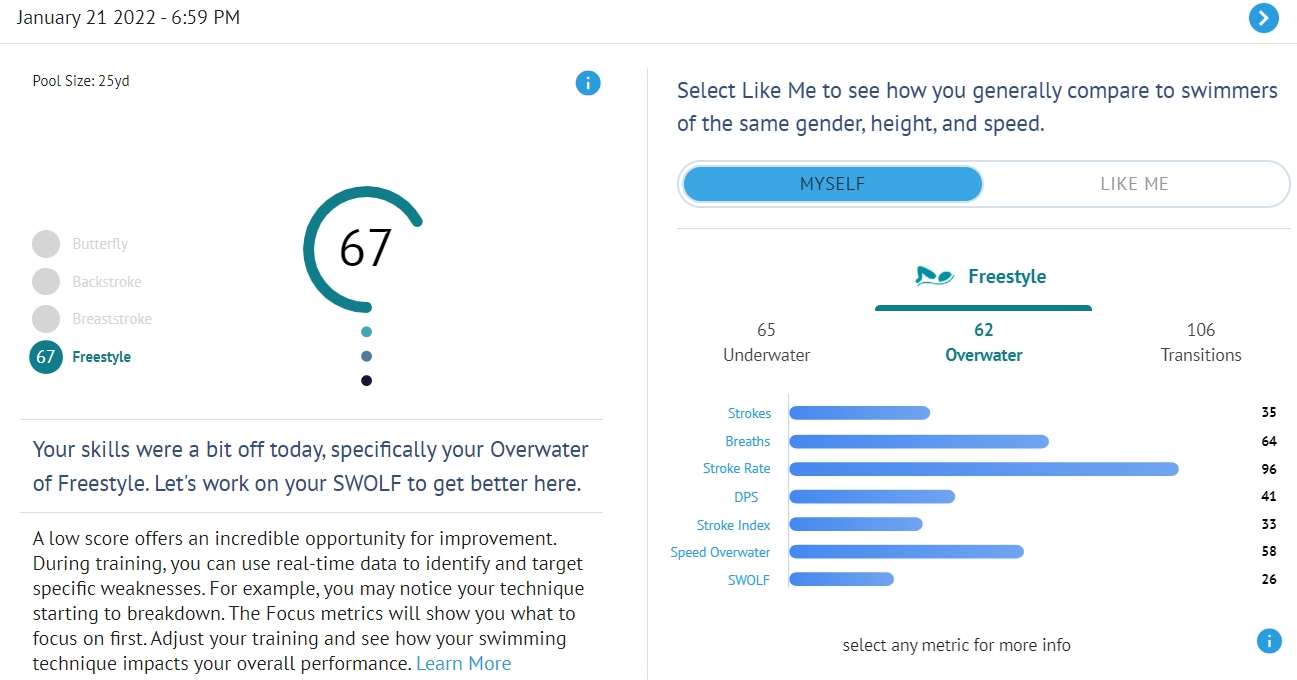
The “Myself’’ displays how your technique changed today compared to the last 30 days. The insights below your Focus score will highlight what part of your swimming needs your attention the most.
![]()
What’s interesting in the athlete’s dashboard is that the three phases under his ‘Myself’ are the exact opposite of what we saw for his ‘Like Me’. The ‘Like Me’ showed us that the swimmer was slower on transitions compared to his competition.
On the flipside under ‘Myself,’ we see the swimmer focusing and excelling on his weaknesses, scoring the highest on his transitions. This is the power of data. The swimmer and his coach have targeted the ”lowest hanging fruits” and are fine-tuning them every day at swim training. His high scores on Transition, Turn and Push Time demonstrate his commitment to improving his turns and overall swimming speed.
Here is a recap of all the time improvements the athlete made in his turns alone.
Make the most of the Focus Progress Graph by aiming to improve your technical skills month over month and get a good sense of how your current tracked behavior in the water affects your swimming speed.
