We asked our swimming data partner TritonWear to help us with a deeper insight into performances and what makes elite swimmers fast and where they can improve. This is their TritonWear analysis.
We got the scoop on data!
Coaches widely use Stroke Count worldwide to quantify athlete progress in swimming skills as a means to measure efficiency. It’s believed that the fewer the strokes, the better the efficiency. But is less, really more? The answer here is yes and no. Both overwater and underwater skills can influence Stroke Count, making it hard to understand what is contributing to the change in the number of strokes.

What We Did
First, we went to our Data Science team here at TritonWear and asked how well Stroke Count relates to swimming freestyle faster and how it compares to other overwater metrics like Stroke Rate (SR) and Distance per Stroke (DPS).
Here is how we did it:
- First, we gathered Freestyle Speed % changes in all of our swimmers for SCM (25 m pool) for a year worth of data.
- Then, we calculated the monthly progress made by each swimmer for the period. In addition, we looked broadly at how all sorts of speed changes (swimming freestyle faster, the same, or slower) over the year were related to the metric changes (if the swimmers’ skills improved, declined, or stayed the same).
- Then, we focused on swimmers who improved the most. How did their metrics (DPS, SR and Strokes) change on average over the period?
- Finally, diving deeper, we checked out metric progressions from 10 swimmers out of the most improved group to explore how they got to their improvements.
What The Data Shows
1) How do metrics changes (changes in Strokes, Stroke Rate and DPS) relate to changes in speed
To answer this:
- We first calculated the difference between the final and initial values for Strokes, DPS and SR. Specifically, we looked at what were their number of strokes, their DPS, and their SR at the end of the one-year period versus the beginning and how these changed.
- We then plotted the differences for each metric against speed gains (in m/s) observed at the end of each period.
- Finally, we added a trend line in the graphs for all users to generalize our findings on the interplay between metric changes and swimming at faster speeds.
Stroke Count-Speed Gains Analysis
| How to read the plots:
The center of the light grey cross represents 0 change in both the display metric and speed gain. To the left of the vertical line is a loss in speed, vs a speed gain to the right. Above the horizontal grey line, is an increase in the metric shown, below the line is a decrease. The light blue dots represent a sample of results from typical swimmers, while the darker dots highlight samples from swimmers who improved their speed the most. |
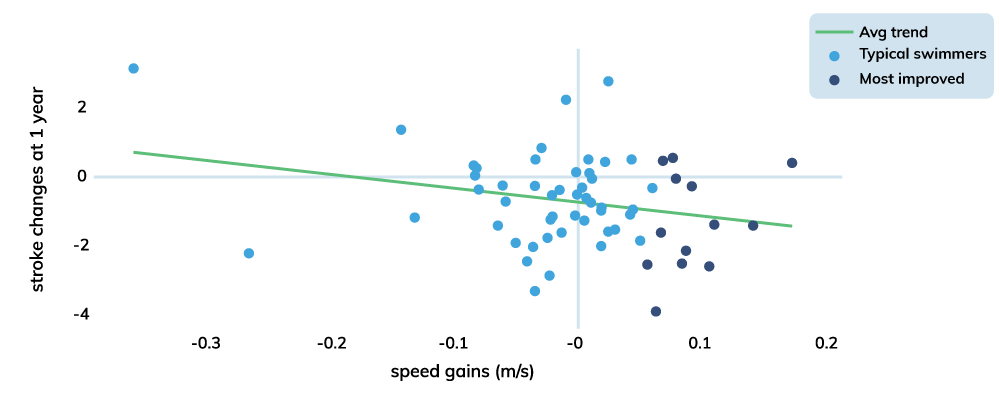
As shown in the graph above, we can see a general trend emerging (shown by the green line) between dropping strokes and increasing speed. The majority of swimmers in our database either increased their number of strokes slightly (1-2) or dropped around two strokes per length. At the same time, these swimmers ranged from a speed gain of just under 0.1 0.08 m/s to a loss of 0.1 m/s. The most significant change in this group is decreasing almost four strokes per length (possibly due to physiological changes).
Lastly, looking at the most improved group of swimmers (dark blue dots), we see speed gains of just below 0.1 m/s up to almost 0.2 m/s – which is a huge gain! For the most part, the swimmers in this group dropped their strokes, with only a very small percent above the zero line.
| Golden nugget: based on the average trend line, getting faster by a rate of 0.1 m/s over a 1-year period represented a decrease in ~0.4 strokes per lap. |
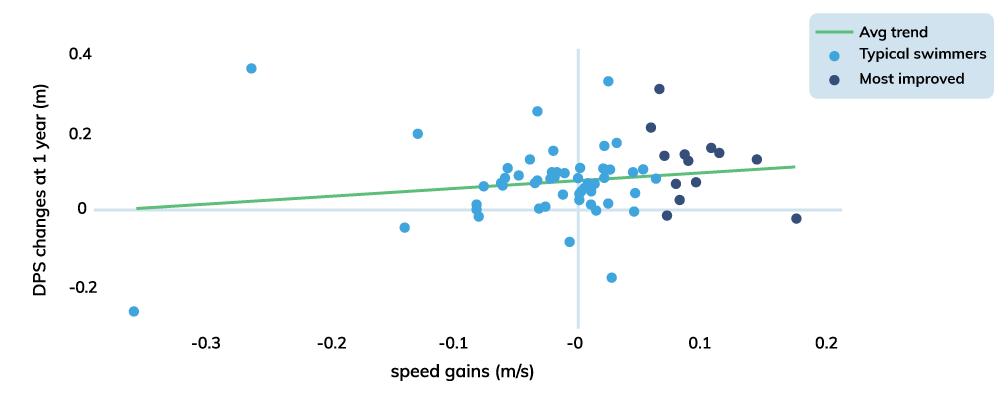
As per the graph above, the general trend (green line) shows that as DPS increases speed increases too. In more detail, the majority of changes during the year were positive as most swimmers were able to increase their stroke length. This increase in stroke length helped most (but not all) of the most improved athletes swim faster. A very small portion of our most improved athletes either maintained their DPS or slightly decreased it.
| Golden nugget: On average for every meter (0.1m/s) of speed gained there was an increase of ~2 cm (0.02m) in Distance Per Stroke. |
Stroke Rate- Speed Gain Analysis
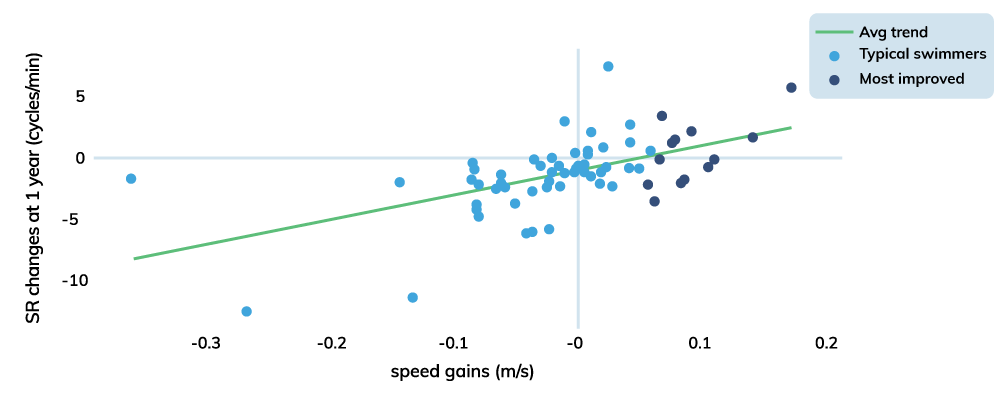
As shown in the graph above, the general trend (green line) demonstrates a relationship between increasing SR and increasing speed. In a closer look, we see that many swimmers, even in the most improved group, lost a few cycles per minute. However, generally, better speed gains were achieved by those who only dropped or added 1-3 cycles/minute through the analyzed period.
| Golden nugget: On average, every 0.1m/s speed gain over one year represented an increase in ~ 2 stroke cycles per minute compared to other swimmers. |
2) How have our most improved swimmers changed their metrics?
How to read the plot:
The left bar graph represents the % change in Speed (light blue) and Speed Overwater (dark blue) at 1 year. The light grey line represents 0 change in speed gain, the bars above the line show an increase in speed anything below the line shows a decrease in speed.
The right bar graph represents the % change in metrics at 1-year. The % change in Strokes is shown with the light blue bar, % change in DPS is shown with the dark blue bar, and % change in Stroke Rate is shown with the green bar. The light grey line represents 0 change in metrics, the bars above the gray line demonstrate an increase in metrics while the bar below the line represents a decrease in metrics.
What we see right away is that the most improved swimmers increased their Average Speed by 6.1% and their Speed Overwater by 9.4% by the end of the year period. What caused this increase in speed?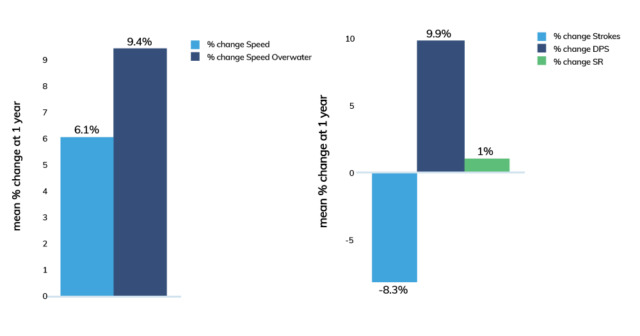
In a closer look at what caused this increase in Speed and Overwater Speed, we found that DPS changed the most, followed by Strokes and SR. In detail, DPS increased by 9.9 %, Strokes decreased by 8.3%, and SR increased by 1 %.
Now that we know the metric combinations that resulted in speed improvements, we focus next on exploring what the individual pathways to speed changes were.
3) How did 10 swimmers from the most improved athletes get there?
To discover how these athletes got faster, we looked at their metric (skill/technique) progression over time. The sparkline plots below (the ones that look like a heart rate) show how their metric values fluctuated over the 1 year period of this analysis.
What’s important here is how individual each swimmer’s progressions are. Many of the paths to improvement were not steady progressions upwards.
We were also interested in checking if the speed changes the swimmers experienced came in tandem with the metric changes (we can say they were strongly associated) or if they were unrelated and didn’t go hand in hand., For example, each time the speed increased, how likely was it that the swimming metric increased (or decreased).
How to read the plot:
Each row below represents a single swimmer’s total percent of speed gain (%) over the year, as well as a map of how their execution of strokes, DPS, and SR shifted through the year. Finally, the arrows portray the relationship between speed gained and the skill metric trend, like this:
- A green arrow up indicates a moderate to strong positive (+) association (When this swimmer got faster, the metric increased).
- A red arrow down indicates a moderate to strong negative (-) association (When this swimmer got faster, the metric decreased).
- A flat blue arrow indicates a weak (+ or -) or non-existent association (The metric change wasn’t really related to their speed change).

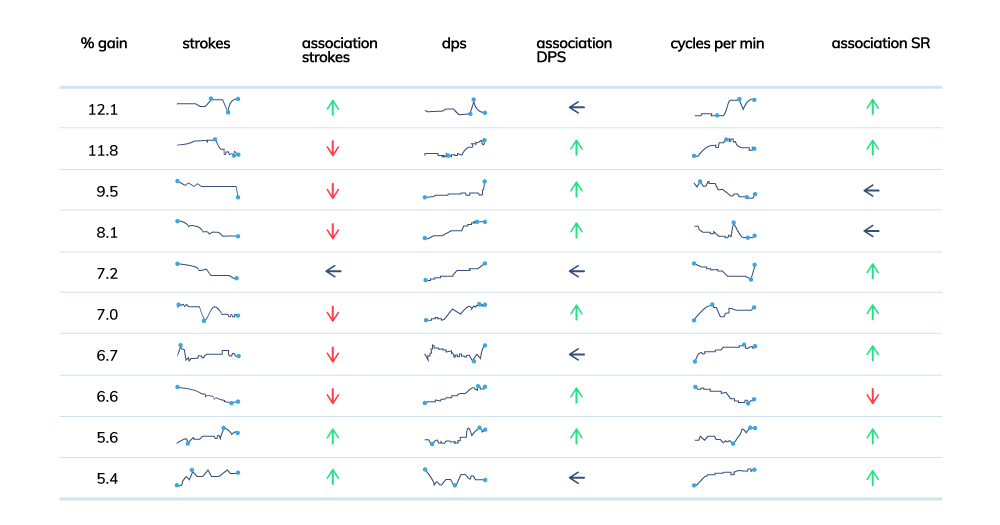
What jumps out immediately is:
- 6 out of the 10 swimmers in the leading improvement group had strokes trending downwards with increasing speed. This, however, means that not all swimmers who got faster after one year lowered their number of strokes. Some had an increase or no significant change in stroke count.
- 6 out of 10 swimmers also had DPS trending upwards with increased speed.
- None of the swimmers had DPS trending downwards. Of course, besides athletes improving their swimming technique and getting stronger, we must also factor in their height changes within that year.
- Interestingly, the great majority (7 out of 10) of swimmers in this group shows that as swimmers got faster, their Stroke Rate increased.
- Only 1 of the top 10 swimmers had Stroke Rate trending downwards with increased speed, and 2 had no clear association.)
- More importantly, the top 2 (out of 10) swimmers both got faster by employing different strategies. If we look closely at the sparklines for each metric we will see that their pathways are not only trending upwards, they peak and fall throughout the year. The first one increased their number of strokes, maintained their stroke length and increased their Stroke Rate by the end of the year. While the other one decreased their number of strokes, increased their stroke length, and increased their Stroke Rate.
This demonstrates that there is no one size fits all solution. What you need to work and improve on will vary individually from swimmer to swimmer, their level, height, and distance events.
Key Takeaways
To conclude, for the swimmers of this analysis, the metrics most closely related with speed improvement and in decreasing order are: increasing DPS, followed by decreasing Strokes, and increasing SR. Long-term gains were typically achieved by high increases in DPS and slight increases in SR accompanied by a decrease in Stroke Count.
Circling back to our initial question, if Stroke Count is still valuable in 2022. The answer is yes, but it is best to look at it in relation to DPS and Stroke Rate to characterize why the stroke count changed:
- increasing Stroke Rate helps to increase Stroke Count,
- increased DPS tends to decrease the Stroke Count
- Both of these scenarios are related to improving speed
Finally, individually, the 10 swimmers from the most-improved group, each had their own progression of metrics – knowing only Stroke Count doesn’t provide a complete picture of their progress.
Discussion
We want to build educational and valuable content for you. In saying this, we also want our blog to be a place of discussion and collaboration, somewhere we can learn from each other.
In our next “get the scoop on data,” we’re thinking of exploring what it takes to get fast quickly (in a shorter time frame, such as three months). Our goal is to showcase the difference in trends between a short-term strategy vs a long-term strategy. We would love to hear your thoughts.

Hmmm. Not really enough data, and your R² for all of these relations must be near zero.
Also, I’m guessing that almost all of your athletes were growing, maturing, getting stronger, etc, and I am guessing you did not control for height and strength gains.
While I like that you are trying to bring data to swimming, you are kind of on the simple end of things. If you do not have 100K users, then perhaps you need to look at other stats that do not have number of athletes as the limiting factor.
no
I would love to see workouts or sets that could lead to improvement in this discussion. I’m looking forward to the article on how to improve in 3 months, or about the average high school season.
You should read “Long Strokes in a Short Season” By: Art Aungst
Swimswam needs to reach out to Cameron McEvoy about this and maybe do an interview. Pretty sure he did a ton of research into the physics and aerodynamics for efficiency leading into 2016 Olympics.
When I was a high schooler in the middle of nowhere in 2000, I heard the best flyers were taking 5 strokes per lap. I tried so much to stretch my stroke out. Wasn’t until I got to college I realized those guys were just going 15m underwater.
No wonder kids are so much faster today.
That’s an awful lot of data, words and graphs to demonstrate something that is self-evident and factually irrefutable.
I’m no math wizard, but I think blanket comparisons between DPS and number of strokes to figure out which matters more isn’t exactly fair. Please hear me out on this one.
DPS and Strokes are closely related, as an increase in DPS will directly lead to a decrease in no. of strokes, all else equal. However, the amount of change isn’t the same simply because of how the math works.
For example, let’s say a swimmer has crazy improvements and has an increase in DPS of 100%, this means he/she will take half the number of strokes, aka a decrease of 50%. So DPS “improved” by 100% but no. of strokes only “improved” by 50%, does that mean DPS… Read more »
Key Variables Overlooked:
1. Wingspan/Height ratio
2. Feet/Hands size
3. Power/Weight ratio
4. Gymnastic build body balance
It is impossible to look at any variable in isolation. Good article but there are lots of factors.
IMO wingspan/height ratio is the biggest physical determinant of how great a swimmer can become. A guy who is 5’10” with a 6’2″ wingspan has an advantage over a guy who is 6’2″ with a 6’4″ wingspan. Some kid on my team was 5’9″ but his wingspan was around 6’3″-6’4″. Looked so large in the water but in reality, was pulling a vessel that was relatively small.
Agreed…and we could even look at the forearm length vs upper arm length vs length across the shoulders ratio. Body proportions are where the real story is.
I’m 5’9″ with a 6’1.5″ wingspan, my hands and feet are firmly average, and while I produce an excellent amount of power, I’m also pulling a substantial amount of weight through the water…not nearly as much of it muscle as I’d like.
I train with both senior group kids and Masters and it’s pretty interesting seeing how those variables play out for us. One of my Masters swimmers is the same height with about the same wingspan, but is ~40 lbs lighter and has a much higher stroke rate than I do (he takes an average of 3-4 strokes more per lap than I do even accounting for underwater differences), while our 50/100 free times are within a tenth of… Read more »
Hey I’m 5’ 10” with a 6’ 2” inch wingspan let’s go!