
With the world shutting down, we’re reaching into our archives and pulling some of our favorite stories from the SwimSwam print edition to share online. If you’d like to read more of this kind of story, you can subscribe to get a print (and digital) version of SwimSwam Magazine here. This story was originally published in the 2016 College Preview edition of SwimSwam Magazine.
Only one swimmer can win Olympic gold, but every swimmer has the opportunity to measure success or not against their own best times. As swimmers, we put hours of work into getting stronger, building more endurance, and becoming more efficient. Yet, for all of the choices people make about swimming in college—which team to swim for, what events to concentrate on, which division to compete in—most swimmers have little idea how much these things actually impact their ability to get faster. Using a couple of years of data on college swimmers, I hope to shed some light on these questions.
Measuring improvement is tricky. So much of a season’s performance depends upon on choosing which events and meets to peak at. These meets and events can vary year to year. To account for this, I chose to compare a swimmer’s top three events to their top three events the following year, using the measure of overall percentile rank in those events. I took any top times that were swum in events both years and compared these to the previous year, striving to only count tapered-swim to tapered-swim improvement. Unfortunately, I didn’t have reliable data for high school swimmers, so I could only look at how people improved from their freshman years onward: admittedly a large omission.
This chart should give an overall baseline for how swimmers improve over their college careers. Shown below is the average percentage improvement of all swimmers, broken down by division and gender.
| Division | Gender | Avg. % Improvement |
| D1 | Women | 0.16 |
| D2 | Women | 0.17 |
| D3 | Women | 0.16 |
| D1 | Men | 0.23 |
| D2 | Men | 0.32 |
| D3 | Men | 0.30 |
The first striking feature is that, on average, swimmers don’t improve much during their collegiate careers. To put a 0.3% improvement in perspective, a 50.00 second 100 yard freestyler who improved 0.3% would have swum a 49.85 the next season. The second is that men tend to improve about twice as much per year as women.
The next graphic shows overall improvement data broken down by gender and year in school/year of eligibility.
| Year | Gender | Avg. % Improvement |
| Sophomore | Women | 0.27 |
| Junior | Women | 0.04 |
| Senior | Women | 0.14 |
| Sophomore | Men | 0.49 |
| Junior | Men | 0.16 |
| Senior | Men | 0.11 |
It is clear from this graphic swimmers tend to improve less as they age. Without high school times, I don’t have freshman year improvement data. I would be surprised if swimmers didn’t improve the most during their freshmen seasons.
Next, I dove into the data by breaking out improvement results by event. I’ll just show a couple of events here to illustrate trends. First, the data showed that breaststrokers tended to improve more across their college careers than swimmers who swam the other strokes.
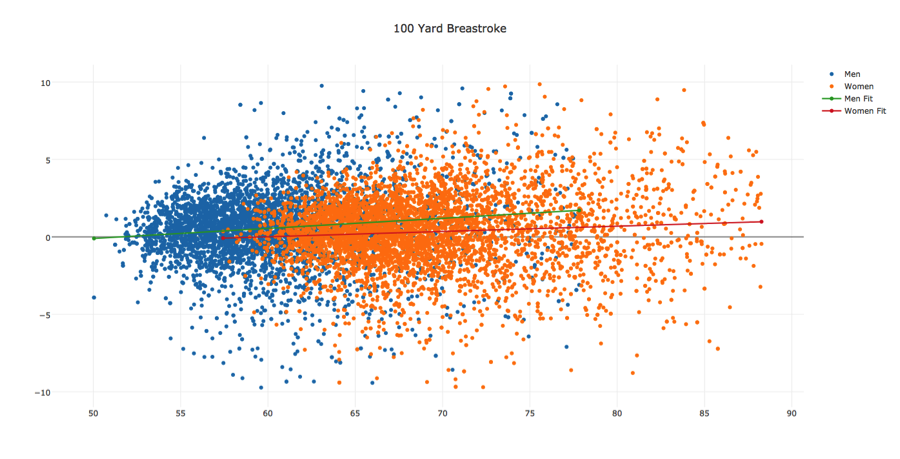
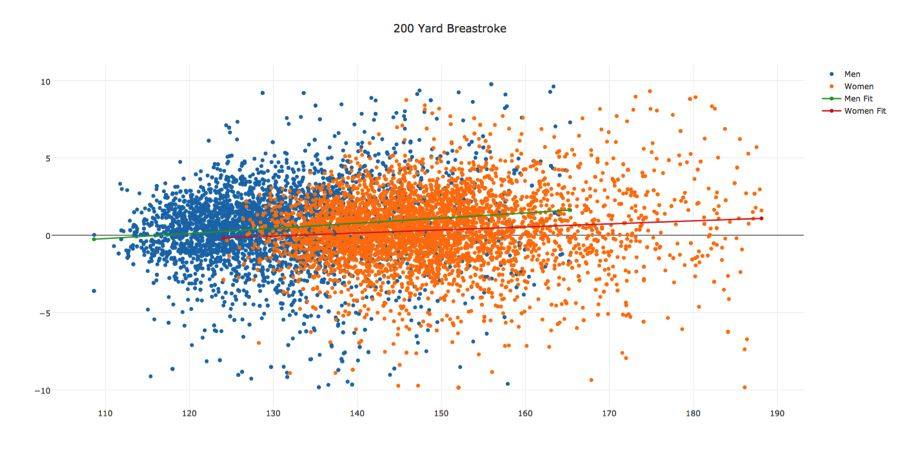
Secondly, the data showed that distance swimmers improve less than sprinters. You can see hints of this trend in the 100 and 200 breaststroke plots, but it becomes much more clear when looking at the 100 and 1650 freestyle events.
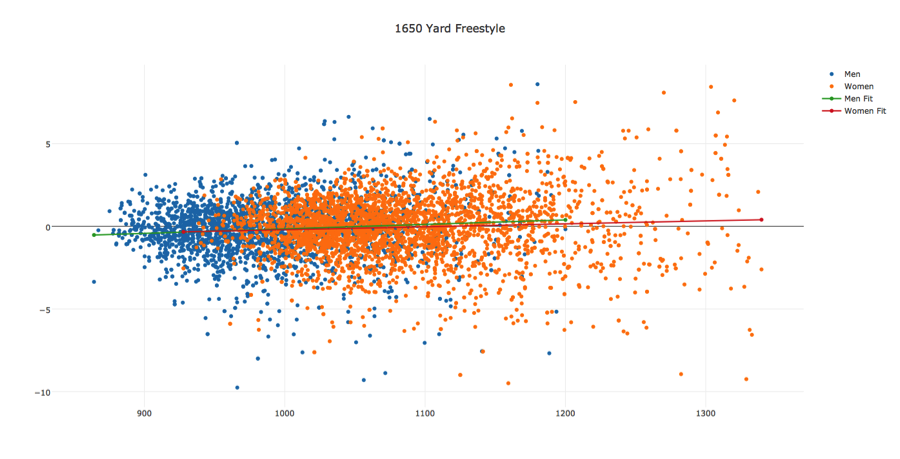
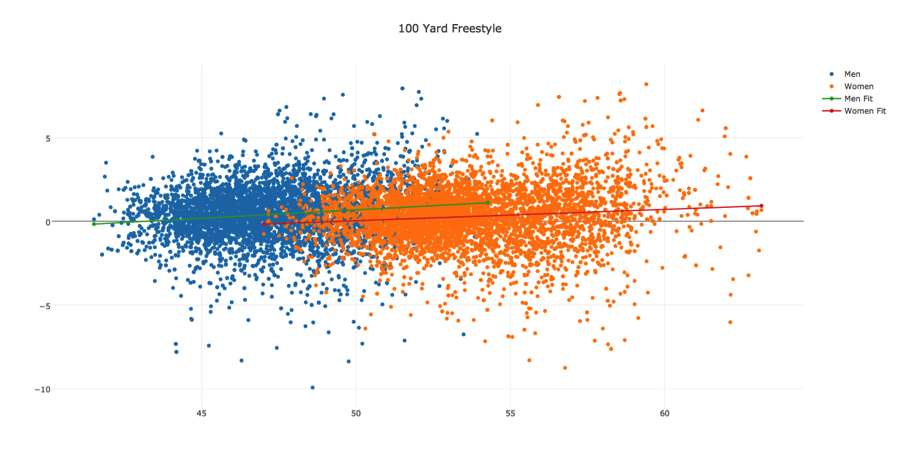
Exactly why this is the case is unclear. As a distance swimmer myself I can acknowledge that part of the issue is distance events take longer to get in shape for and year-round commitments to swimming became more difficult the older I got as the rest of life got in the way. Another explanation might be that sprinting is more technical than distance swimming, which makes it possible to improve even if your strength and endurance do not. This might explain why breaststrokers tend to improve more than swimmers in the other strokes, since breaststroke is usually thought of as the most technically complex stroke.
Another trend, though small, emerges across the board: fast swimmers tend to improve less than slower ones, even when looking at improvement as a percentage. The data here doesn’t explain why, but there are a couple different reasons for this that I could postulate: better swimmers are closer to their training peaks, regression to the mean, i.e. fast swims tend to be outliers, and the fact that drag forces increase proportionate to the square of velocity in water (approximately). But without more data, it is difficult to tell.
Another hypothesis I wanted to test was to see how improvement factored into building the top college teams. Since the best collegiate programs tend to attract the best coaches and the most dedicated swimmers, I would expect them to improve the most. Improving your swimmers is one of the keys to building a great program, in theory. Of course recruiting and retaining good swimmers probably has a stronger correlation ultimately, but recruits are supposed to make those decisions largely on how much they think they can improve in a given program.
Shown here are the average improvement percentages for the top 25 men’s and women’s programs at last year’s NCAA Championship meets plotted against a metric that shows their team strength on the national level in 2016.
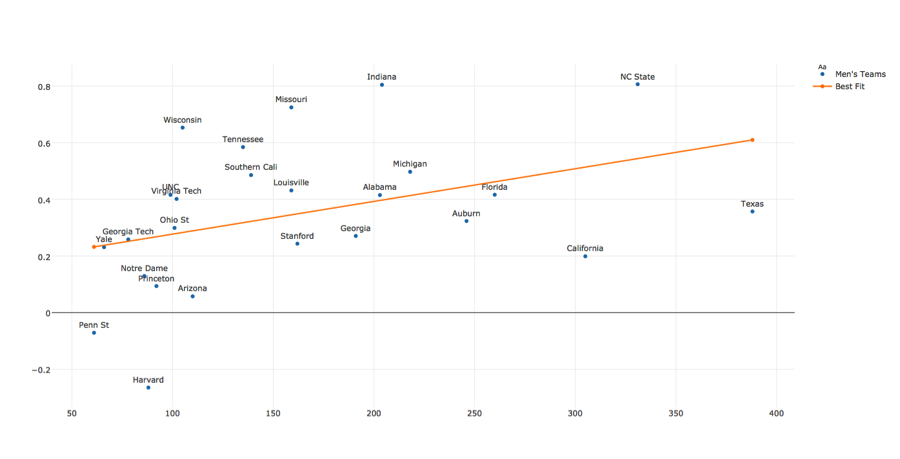

These graphs show that team strength and improvement are probably correlated, but not in a way I would have expected. I’m not entirely sure if the fact that top men’s college teams improve their swimmers more than top women’s teams is really a trend or its just due to the small data set. I would tend to think the latter since I don’t really have a good explanation why it might be the case.
Getting faster in college is difficult; even the fastest swimmers at the top programs won’t improve much. So if you’re a college swimmer at least take solace in the fact that averages aren’t everything and getting better than your competition may not be quite as challenging as it used to be.
Yeah physical development is a huge factor when it comes to improvement in swimmer’s times. But let’s look at teams that are combined over teams that are split into male/female teams. The top schools like Cal, Stanford, UF, Texas. ALL have split programs and all tend to stay within the top 5-10 NCAA D1 teams consecutively year to year. Even within a year, it’s hard to not notice that the UF women’s team improved immensely. Let’s start addressing needs by physical development rather than grouping two extremely different groups with different physicalities together
Really interesting stuff. Lots of changes in programs since 2016, I would love to see a re-do of this with current (well, last year) data. Also there is lots of pre-college data out there now; as is mentioned in the article it would be interesting to see improvement from HS to college.
Texas A&M plus Steve Bultman/Tanica Jamison= Big improvements!
Steve Bultman does not get the credit or recognition he deserves. Class act and world class coach!
Great work. Love this stuff.
Couple of questions:
1. ) Any chance to list the event by event improvement plus SD and the N in each event?
2. ) Could you list the SD and N for each year of impovement?
3. ) In looking at the improvement graphs I noticed a huge range of times ( ex. women’s 100 free :47 up to 1:04+) when looking at a smaller elite subset (ex. faster then :53) rate of improvements really are not any different. Subject pools matter.
I think this is fascinating to see. I would wager that the top programs in the country for D1 wouldn’t have larger time drops as other programs. The top kids recruited have already been lifting weights to get to that point (or the vast majority). I’ve seen girls that have lifted when they are younger, plateau junior and senior years of high school, and wonder how that changes once they get to college and perhaps have a different lifting program. What about the kids that don’t get the volume of training in high school that they do in college?
Interesting to see Wisconsin have such high levels of improvement on both the men’s and women’s side… and Cal among the worst for both?? Crazy. Nice analysis.
Cal is recruiting athletes that may already be at the top of what they are capable of. Schools like Wisconsin have a better chance of picking up a swimmer with more development still to come. Cream of the crop vs Diamond in the rough
I’m not sure if this is correct or not, but Yuri is the common denominator in both programs. Was Cal improving more when he was there? Did Wisconsin’s improvements jump when Yuri moved to Wisconsin? I honestly don’t know, but I do think Yuri is one of the top collegiate coaches.
Cal has for the last 15 years gotten the best recruiting in the nation (on average) bar none.
It comes to the surprise of absolutely no one who has paid close attention to their program that their attrition rate and improvement rate in their kids is simply not the same as at other programs. This fact is often overlooked by noting their number of immense successes. Swimming and training at that level aint for everyone, even if youre a 5 star HS recruit.
It would be interesting to see these results for DII and DIII. Also, would it be better to do a raw drop. Ie. how much someone dropped over the entire course of their college career vs year to year?
Each year of training and competition also increases odds of acquiring/accumulating injuries that affect one’s ability to keep dropping time…