
2017 FINA WORLD CHAMPIONSHIPS
- Sunday, July 23rd – Sunday, July 30th
- Budapest, Hungary
- 50-Meter Course
- Event Schedule
- Meet Info
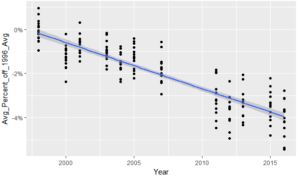
A few months ago I wrote an article for SwimSwam Magazine about the existence of a post Olympic hangover in world championship times.
A quick summary: I grabbed all World Championships and Olympics from 1996-2016 and excluded 2008 and 2009 (due to the super suits). Overall, men’s average finals times improved .18% per year and women’s average finals times improved .21% per year. However, in post Olympic years, time got slower instead. Finals times averaged about .2% slower than the year before in post Olympic years. The theory is that top swimmers retiring or taking time off after the Olympics explains this “hangover.”
Average Time in a Men’s Final vs Average Time in 1996 Final

Average Time in a Women’s Final vs Average Time in 1996 Final
The existence of a post Olympic hangover is pretty clear in the existing data. 4 post Olympic years with 100s of swimmers across finals in all events is enough to establish a significant trend. However, it’s one thing to find a trend in past data and another to see that trend borne out in the results of meet that hasn’t happened yet. Correctly predicting future results is truly the best test of a theory.
To that end I calculated the projected average finals times for each Olympic event assuming that the post Olympic hangover is a real effect and assuming that there is no hangover and that the results will follow the overall long term trend. After the meet is over, I’ll check back and see which prediction does better (or see if they’re both way off base).
| Event | Gender | Time Change From 1996 to 2016 | Average 2016 Finals Time | Average 1996 Finals Time | Projected 2017 Finals Average With “Hangover” | Projected 2017 Finals Average without “Hangover” |
| 100 Fly | Women | -5.4% | 56.64 | 59.9 | 56.75 | 56.52 |
| 100 Back | Women | -5.4% | 58.86 | 1:02.2 | 58.98 | 58.74 |
| 400 Medley Relay | Women | -4.9% | 3:55.74 | 4:07.76 | 3:56.21 | 3:55.25 |
| 200 Breast | Men | -4.8% | 2:07.81 | 2:14.31 | 2:08.07 | 2:07.58 |
| 200 Back | Men | -4.8% | 1:55.09 | 2:00.88 | 1:55.32 | 1:54.89 |
| 100 Back | Men | -4.5% | 52.68 | 55.18 | 52.79 | 52.59 |
| 50 Free | Women | -4.5% | 24.23 | 25.37 | 24.28 | 24.18 |
| 100 Free | Women | -4.2% | 53.05 | 55.37 | 53.16 | 52.94 |
| 100 Free | Women | -4.2% | 53.05 | 55.37 | 53.16 | 52.94 |
| 200 IM | Women | -4.2% | 2:09.92 | 2:15.6 | 2:10.18 | 2:09.65 |
| 200 Free | Women | -4.0% | 1:55.12 | 1:59.95 | 1:55.35 | 1:54.88 |
| 100 Breast | Men | -4.0% | 58.99 | 1:01.46 | 59.11 | 58.88 |
| 400 Medley Relay | Men | -4.0% | 3:30.96 | 3:39.72 | 3:31.38 | 3:30.58 |
| 200 IM | Men | -3.9% | 1:57.13 | 2:01.87 | 1:57.36 | 1:56.92 |
| 800 Free Relay | Women | -3.7% | 7:48.93 | 8:07.05 | 7:49.86 | 7:47.94 |
| 100 Breast | Women | -3.7% | 1:06.47 | 1:09.02 | 1:06.6 | 1:06.33 |
| 400 Free Relay | Women | -3.7% | 3:34.64 | 3:42.88 | 3:35.07 | 3:34.19 |
| 200 Back | Women | -3.7% | 2:07.85 | 2:12.69 | 2:08.1 | 2:07.58 |
| 400 IM | Women | -3.6% | 4:33.15 | 4:43.48 | 4:33.7 | 4:32.58 |
| 200 Breast | Women | -3.6% | 2:22.37 | 2:27.73 | 2:22.66 | 2:22.07 |
| 50 Free | Men | -3.5% | 21.67 | 22.47 | 21.72 | 21.63 |
| 100 Fly | Men | -3.4% | 51.28 | 53.08 | 51.38 | 51.19 |
| 800 Free | Women | -3.1% | 8:18.68 | 8:34.89 | 8:19.67 | 8:17.63 |
| 400 Free Relay | Men | -3.1% | 3:12.38 | 3:18.6 | 3:12.77 | 3:12.04 |
| 200 Fly | Women | -3.1% | 2:06.4 | 2:10.47 | 2:06.65 | 2:06.13 |
| 800 Free Relay | Men | -3.1% | 7:05.65 | 7:19.26 | 7:06.5 | 7:04.88 |
| 400 Free | Women | -2.8% | 4:03.08 | 4:10 | 4:03.56 | 4:02.57 |
| 400 Free | Men | -2.7% | 3:44.24 | 3:50.57 | 3:44.69 | 3:43.84 |
| 100 Free | Men | -2.7% | 47.96 | 49.31 | 48.05 | 47.87 |
| 200 Fly | Men | -2.7% | 1:54.77 | 1:57.97 | 1:55 | 1:54.57 |
| 200 Free | Men | -2.7% | 1:45.48 | 1:48.4 | 1:45.69 | 1:45.29 |
| 1500 Free | Men | -2.6% | 14:46.81 | 15:10.29 | 14:48.58 | 14:45.21 |
| 400 IM | Men | -2.5% | 4:11.22 | 4:17.6 | 4:11.72 | 4:10.77 |
Well, after reading about day 1 finals, I’d have to say this is better than the Olympics. What an amazing session of racing!
Average finals times today were slower than the Olympics in 3 out of 4 events. First time is today’s finals average. 2nd time is last year’s Olympics finals average.
Men 400 Free 3:44.56 3:44.24
Men 400 Free Relay 3:12.31 3:12.38
Women 400 Free 4:03.94 4:03.08
Women 400 Free Relay 3:34.72 3:34.64
Andrew,
Good and simple analysis. Thank you. The numbers certainly don’t lie.
I guess to me it just “felt” qualitatively exciting when looking at some of the amazing and entertaining races: Brazil comes up big in mens 4×100 relay, USA holds on for the win in that close race, Dressel’s 47 low leadoff for the AR, Sjostrom’s WR in 100 free lead off relay leg, fast times by Peaty and Ledecky. Great day of racing overall and some of that excitement doesn’t show up in the numbers.
This was confuuuuusing.
So you basically plotted all WC and Olympic final times from ’96 (barring ’08 and ’09) and made a trendline. You then saw that the WCs immediately following an Olympic year were slower than the trend predicted?
The charts are harder than they have to be, too – I’d have the x-axis ticked off at every 4 years, so it’s easier to see where the Olympic years are. Looking at those, it looks like the drops in Olympic years are also slightly higher than the trendline would predict?