When Great Britain won the rights to host the 2012 Olympics, as many future hosts do, they began pushing huge resources into Olympic sports. The idea was to try and win as many medals at their home games as possible, but at least in swimming the results didn’t really materialize. Team GB won only 3 medals, a silver and two bronzes, a let down compared to the 2 golds and 6 total medals they won in Beijing.
So what’s happened since then?
After the games, UK Sport cut it’s funding for swimming by £4 million annually, from £25 million to £21 million, but the medal total actually improved at the Rio games (1 gold, 5 silvers). Great Britain won the second most golds (9) and 2nd most total medals (24) at this summer’s European championships, their best Euros of the decade. While too late for their home Olympics, Great Britain now has a world class group of swimmers.
Since London, the top end of British swimming had, in aggregate, steadily improved. The average top 10 time in 2016 for UK men’s swimmers was faster than 2012 in 10 of 13 Olympic events, and 7 of 13 women’s event were faster than 2012 in 2016 (no men’s 800 and women’s 1500; they weren’t in the 2012 or 2016 games).
However, this year, while the medals were there, British depth disappeared. Only 5 of 13 men’s events in 2018 had a faster top 10 average than 2012, and only 3 of 13 women’s events were faster than 2012, a noticeable drop off from recent years.
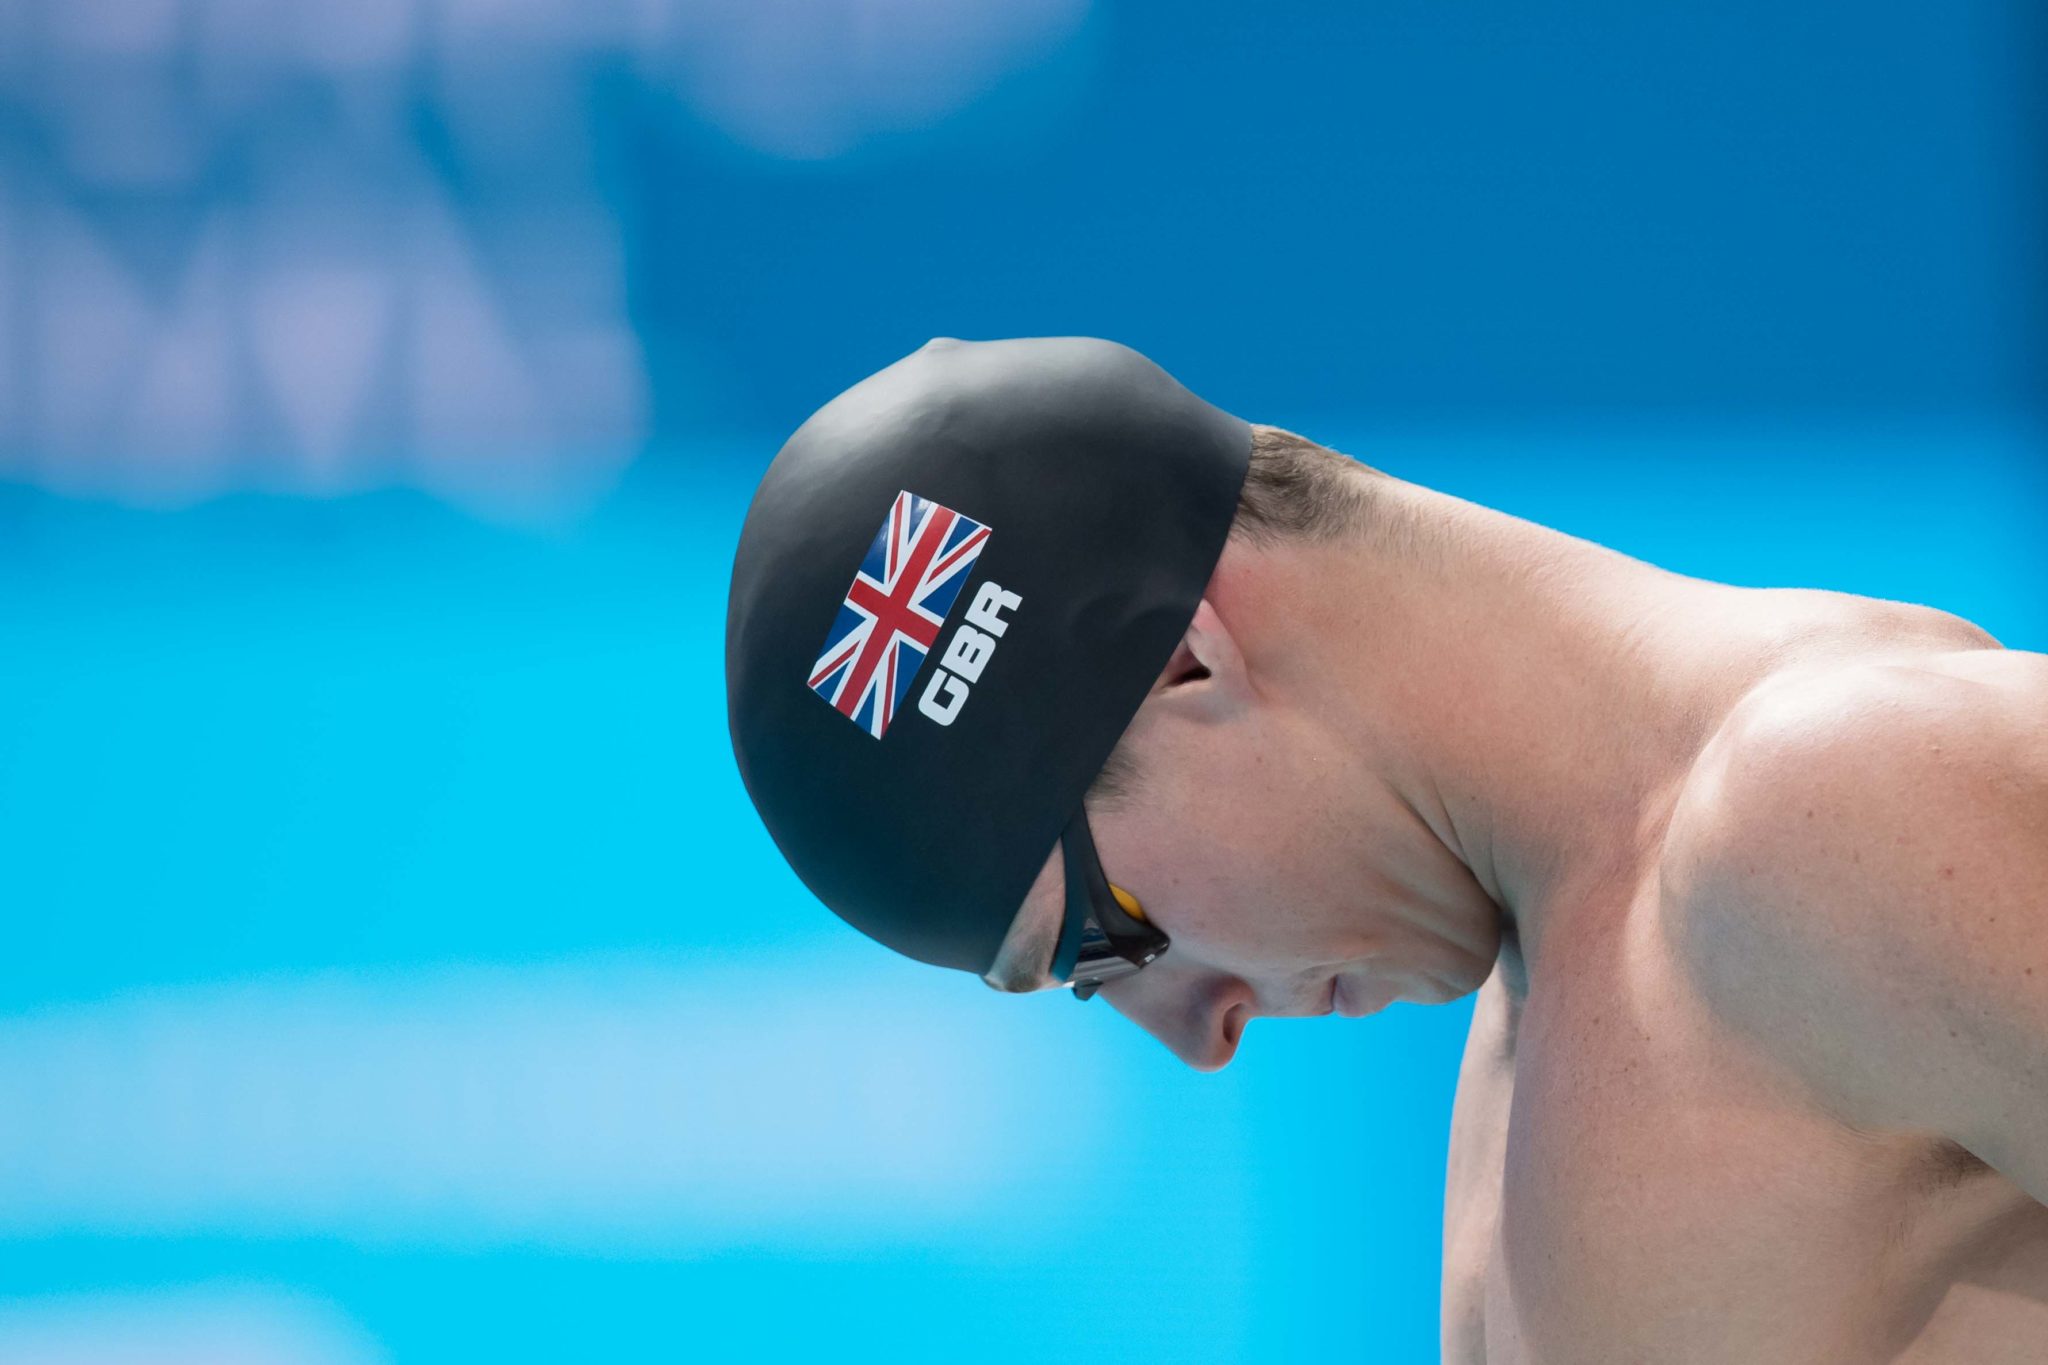
In 2017 the top 10 times for British women were an average of .4% faster than 2012. This year they were an average of .2% slower than 2012. British top 10 men went from a 2017 average of .4% faster than 2012 to only .1% faster this year (both changes p<.01). Observe on the graphs below how dramatic the time change is this year compared to any other year or compared the the U.S. or world data. Something was off this year.
Average Top 10 Time vs 2012 Average Top 10 time
Negative is faster. Positive is slower
For example: I compared the average top 10 time 100 back time in 2012 for female British swimmers (1:00.99) to the average top 10 100 back time in 2013 (1:01.17). A difference of .4%. The average difference for all Olympic events in 2013 was .2%. That is the number plotted in the graphs below.
Men
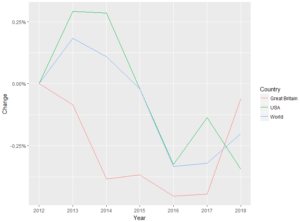
Women
What’s the explanation for this big swing?
The first thing that comes to mind is this year’s status as the mid point of the Olympic cycle. Traditionally this is a transition moment for national programs. The old guard retire after their final Olympics and a new group of young swimmers have to step up to replace them.
The U.S. provides a text book example of what this looks like. Average top 10 times were slower in 2013 and 2017 than the year before for both U.S. men and women (see above graphs). Average age of top 10 U.S. men’s swimmers fell from 23.7 in 2012 to 22.4 in 2013 and from 22.8 in 2016 to 21.6 in 2017. U.S. women saw a similar effect. Average top 10 age in 2012 was 21.1 and 2013 was 20.6. In 2016 the average age was 21.5 and in 2017 it fell to 20.8. It looks like a pretty clear explanation: the older veterans retired after the Olympics and their absence hurt times. However, the British data looks quite different.
British men also saw an age drop off the year after the Olympics (2012 21.9-> 2013 21.2; 2016 22.6-> 2017 21.1), but the average top 10 time didn’t drop off in either post Olympic season. British top 10 women have had a pretty stable average age across the last 7 years. In 2013, when their times fell off a bit from 2012, they were actually older on average than the year before (2012 20.1-> 2013 20.3). In 2017 when British women’s times improved a small amount from 2016 the average age remained the same (2016 20.3-> 2017 20.3).
If retirements were the explanation, the British men’s drop off should have happened in 2017, not this year when the average age remained stable at 21.2. In 2018, British women actually had their oldest group of top 10 swimmers of the last 7 years (2018 average: 20.4), so retirements don’t seem a likely theory there either.
Instead the drop off seems to be because returning swimmers were simply worse this year. British women with a top 10 time in an event both last year and this year were an average of .5% slower this year in the repeated top 10 event (90 data points). British women with a top 10 time in both 2017 and 2016 were an average of .9% faster in 2017 (86 data points).
The men saw a similar drop off. Men with a top 10 time both this year and last were an average of .2% slower this year (92 data points). Men with a top 10 time in 2017 and 2016 were an average of .2% faster in 2017 (73 data points).
That is a significant change in returning swimmer behavior for both genders (p<.01).
Speculation about why returning swimmers were so slow in 2018
Maybe the effects of the reduced funding are finally being felt. Sometimes the effects of budget cuts aren’t felt right away. It takes time for the cracks to show. Clubs haven’t been as supported from the top as much as in the build up to London (post Rio success, pre 2012 funding levels weren’t restored. Current funding is £22 million) and perhaps that affected training environments.
Maybe the increased centralization/loss of coaching talent has had some effect. John Szaranek and Jon Rudd left top British coaching jobs to lead Swim Ireland. Mel Marshall moved from Derby to join an already loaded Loughborough coaching staff, pulling coaching talent away from a smaller club.
Swim England Winter Championships were short course this year after being contested long course last year. Perhaps fewer top long course meets on the schedule was a factor.
Ultimately, I don’t know what caused the returning swimmer slow down this year. I’d be interested to hear other theories in the comments.
Is this a one year blip? Maybe. It’s hard to say. It’s certainly concerning long term. While the current crop of top end swimmers produced medals this year, future medalists will need to emerge from the second tier of swimmers. If the level of the second tier is lower overall, fewer star swimmers will emerge and the ones that do will be less prepared to take on the rest of the world.
Great Britain Average Top 10 Times Annually Since 2012
Men
| 50 Free | 100 Free | 200 Free | 400 Free | 1500 Free | 100 Back | 200 Back | 100 Breast | 200 Breast | 100 Fly | 200 Fly | 200 IM | 400 IM | |
| 2012 | 22.65 | 49.55 | 1:48.33 | 3:50.73 | 15:21.13 | 55.18 | 1:59.46 | 1:01.09 | 2:12.06 | 53.06 | 1:58.41 | 2:00.67 | 4:17.62 |
| 2013 | 22.59 | 49.86 | 1:48.29 | 3:50.32 | 15:22.97 | 54.75 | 1:58.77 | 1:00.86 | 2:11.85 | 53.10 | 1:58.66 | 2:00.43 | 4:18.52 |
| 2014 | 22.57 | 49.78 | 1:48.18 | 3:48.16 | 15:12.03 | 54.64 | 1:59.41 | 1:00.54 | 2:10.73 | 53.02 | 1:58.52 | 2:00.5 | 4:18.13 |
| 2015 | 22.60 | 49.40 | 1:47.6 | 3:48.73 | 15:16.94 | 54.52 | 1:59.82 | 1:00.44 | 2:10.56 | 53.11 | 1:58.77 | 2:00.39 | 4:19.39 |
| 2016 | 22.47 | 49.45 | 1:47.56 | 3:48.74 | 15:09.52 | 54.83 | 1:59.94 | 1:00.29 | 2:10.81 | 52.85 | 1:59.27 | 2:00.13 | 4:18.99 |
| 2017 | 22.39 | 49.46 | 1:47.38 | 3:48.56 | 15:16.82 | 54.92 | 1:59.55 | 1:00.37 | 2:11.54 | 52.92 | 1:58.47 | 1:59.83 | 4:19.44 |
| 2018 | 22.38 | 49.73 | 1:47.8 | 3:51.12 | 15:30 | 54.86 | 1:59.92 | 1:00.19 | 2:12.08 | 53.19 | 1:59.32 | 1:59.88 | 4:19.36 |
Women
| 50 Free | 100 Free | 200 Free | 400 Free | 800 Free | 100 Back | 200 Back | 100 Breast | 200 Breast | 100 Fly | 200 Fly | 200 IM | 400 IM | |
| 2012 | 25.56 | 55.13 | 1:58.71 | 4:09 | 8:35.4 | 1:00.99 | 2:10.87 | 1:08.94 | 2:29.57 | 59.18 | 2:10.41 | 2:13.31 | 4:43.62 |
| 2013 | 25.45 | 55.52 | 1:59.42 | 4:10.5 | 8:36.19 | 1:01.17 | 2:12.22 | 1:08.7 | 2:29.15 | 59.34 | 2:10.57 | 2:13.17 | 4:43.66 |
| 2014 | 25.34 | 55.10 | 1:58.68 | 4:10.07 | 8:33.4 | 1:01.21 | 2:12.29 | 1:08.83 | 2:27.89 | 58.85 | 2:10.2 | 2:13.01 | 4:42.82 |
| 2015 | 25.47 | 55.17 | 1:59.06 | 4:10.71 | 8:34.83 | 1:00.71 | 2:11.48 | 1:08.3 | 2:26.71 | 59.21 | 2:10.57 | 2:13.35 | 4:42.21 |
| 2016 | 25.44 | 55.21 | 1:59.05 | 4:10.32 | 8:35.62 | 1:00.71 | 2:11.21 | 1:08.19 | 2:26.89 | 59.20 | 2:10.29 | 2:13.15 | 4:42.72 |
| 2017 | 25.45 | 55.06 | 1:59.5 | 4:10.48 | 8:39.62 | 1:00.58 | 2:11.06 | 1:07.93 | 2:25.82 | 58.85 | 2:09.59 | 2:12.9 | 4:41.92 |
| 2018 | 25.58 | 55.40 | 1:59.83 | 4:12.59 | 8:41.87 | 1:01.09 | 2:12.16 | 1:08.27 | 2:26.7 | 59.13 | 2:10.44 | 2:13.55 | 4:44.78 |
Surely we should expect a drop off in times in “non-Olympic/Worlds years”. It is difficult to swim constantly at peak levels and so looking at “off” years in this way would show these results. What I think would be more interesting is to understand how things looked major comp to major company thus whether the new performance approach with national qualifying window etc. Is actually driving improved performance or not?
If this year falls within expectations, then why is it so different from Great Britain in 2014, the US in 2018, or 2014 or the world data in 2014 or 2018? I checked those things to see what we should expect, and what I saw was not this. In theory, without the comparison data, what you said is reasonable, but how do you explain every other data point that fits the “non-Olympic/Worlds year” description?
UK Sport system does not encourage depth, it supports ‘few’ with the theory being they are more likely to medal…
Andrew, you do absolutely incredible work. Thank you for your statistical analysis of all swimming-related topics.
Always good to hear people enjoy reading it.