
Different NCAA programs train differently. Some swim extremely broken down during the season. Some swim relatively fresh at their in season meets. We can get a sense of each team’s training style by looking at how they taper. Past tapers can also provide clues about how teams are going to perform at the end of the season this year. I wrote an overview of college tapers for the magazine a while back, which you can read here, but the team by team break down was limited to only elite D1 teams due to space concerns.
Swimulator’s taper tool has no such restraints. This tool compares swimmer’s top 3 events at the end of the season to a swimmers top/average time at different points during the season. For example, in 2015 Cal women’s swimmer’s top times in their top 3 events were an average of 4.3% better than their average time in those events as of week 16 (i.e. the average of all times swum in that event up to week 16 of the 2015 season. Week 0 is 10/15/15).
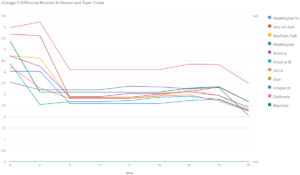
Here are the average time plots for the Pac 12 women for the last 2 years. Cal has a noticeably above average taper from their average times. I expect this pattern to be repeated again this year. Scoring nationals based on top times so far this season puts Cal in second, 41 points behind Stanford. Scoring nationals based on average times so far this season puts Cal in third, 187 points behind Stanford.
2015 Pac 12 women’s best 3 times vs average time that season to that point for each week.
2016 Pac 12 women’s best 3 times vs average time that season to that point for each week.

Another example. The ACC women’s meet looks extremely competitive between NC State and Virginia this year. NC State recently won a close dual meet between the two (recap). Scoring out ACC’s by average time so far this season puts Virginia 1 point ahead of NC State. The taper history from the last two years favors NC State. Last year their taper was much, much bigger than any one else in the conference and in 2015 their taper was pretty average, but still about .5% bigger than Virginia’s.
2015 ACC women’s best 3 times vs average time that season to that point for each week.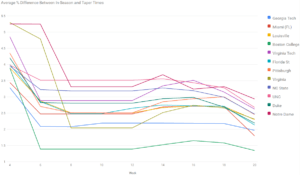
2016 ACC women’s best 3 times vs average time that season to that point for each week

I’m not going to include too many examples here as I think these charts are easier to read directly on the Swimulator site. There it’s possible to mouse over the lines to tell what the exact values are at each point and hover over two similarly colored lines to tell which is which team. If there are specific conferences/team’s you’re interested in, I encourage you to check out the Swimulator page and run the tool for the conference you’re interested in.
Curious why you used average time to date instead of best time to date? If a team focused on a mid season meet it could get washed out in the average and not be represented in the analysis.
This late in the season average times more accurately predict end of season meets. Here’s an analysis of average vs top times methodology: https://swimswam.com/good-mid-season-conference-projections/
Well, there you go, nice work my friend.
Interesting
One thing I noticed, no diving included. It seems like an easy add. Would give a better representation for conference ranks.
This looks like an analysis that a professional gambler would do. Can you analyze the New England Patriots taper patterns in the last 5 years? I need the info by this weekend.
Excellent article on numeric patterns. This is a great way to predict performance. Please keep up the great work!
Interesting data but while some D3 conferences are includes it appears you have no results for NESCAC?
Hmm… There are times in the system for the NESCAC in the relevant time period. (http://swimulator.herokuapp.com/conference?conference=NESCAC&season=2016&taper=Top+Time&date=Whole+Season&heats=16&gender=Women&division=D3) However, the taper chart is acting oddly. I’ll look into it. Thanks.
NESCAC would be interesting since they follow a different schedule than everyone else, too!
My thoughts exactly. Most teams, with notable exception of Tufts, do not rest or suit up “mid-season” given their November 1st start date so it’s one taper for Conference and re-taper 4.5 weeks and 3.5 weeks for women, and men, respectively, later for Nationals.