
We’ve done a lot of projections of conference meets based on in season times, (D1 big conferences, D1 small conferences, D2, D3 part 1, D3 part 2) but haven’t really quantified how reliable those projections are.
Swimulator has two methods for scoring out a conference meet, using swimmer’s best time so far this season or a swimmer’s average time in each event so far this season. How does each perform? Which is better? To answer this I looked at 10 D1 men’s conferences and compared the Swimulator scores last season through 1/24/16 for the average and top times to the actual scores at conference meets (which include diving, so there’s some unaccounted for variance).
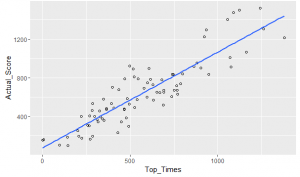
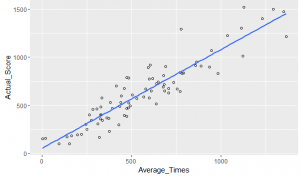
The average times performed a bit better (though both methods performed pretty well). A regression of average time scores on actual scores gives an R^2 of .85; whereas, a regression of top time scores on actual scores give an R^2 of .79 (R^2 is the % of variance in the data accounted for in the regression). I also compared team’s places with each projection method to their actual place. Average time was again a bit better with and average place miss of 1.1 with a standard deviation of 1.1 vs an average place miss of 1.2 with a standard deviation of 1.1 for top times.
Top Times vs Actual Score
Average Times vs Actual Score
Here is the conference level data I used:
ACC
| Top Times as of 1/24/16 | Average Times as of 1/24/16 | Actual Score (w/ diving) | |
| NC State | 1056 | 1229 | 1401 |
| Louisville | 1162 | 945 | 1067 |
| UNC | 606 | 934 | 897 |
| Virginia Tech | 517 | 594 | 892 |
| Georgia Tech | 681 | 598 | 776 |
| Virginia | 787 | 734 | 737 |
| Notre Dame | 436 | 459 | 677 |
| Duke | 668 | 771 | 643 |
| Florida St | 738 | 505 | 606 |
| Pittsburgh | 449 | 338 | 345 |
| Boston College | 206 | 199 | 192 |
Atlantic 10
| Top Times as of 1/24/16 | Average Times as of 1/24/16 | Actual Score (w/ diving) | |
| Massachusetts | 767 | 580 | 671 |
| St. Bonaventure | 364 | 328 | 482 |
| La Salle | 465 | 482 | 473.5 |
| St. Louis | 326 | 286 | 457.5 |
| GW | 221 | 266 | 398 |
| George Mason | 330 | 460 | 396 |
| Davidson | 341 | 362 | 371 |
| Fordham | 271 | 321 | 165 |
Big East
| Top Times as of 1/24/16 | Average Times as of 1/24/16 | Actual Score (w/ diving) | |
| Xavier | 744 | 783 | 832 |
| Georgetown | 616 | 618 | 781 |
| Seton Hall | 693 | 706 | 672.5 |
| Villanova | 465 | 474 | 469 |
| Providence | 286 | 220 | 196.5 |
Big 10
| Top Times as of 1/24/16 | Average Times as of 1/24/16 | Actual Score (w/ diving) | |
| Michigan | 1089 | 1348 | 1475 |
| Indiana | 1261 | 1113 | 1304 |
| Ohio St | 934 | 777 | 1293 |
| Minnesota | 498 | 603 | 919 |
| Wisconsin | 947 | 982 | 832 |
| Purdue | 630 | 641 | 725 |
| Iowa | 689 | 638 | 515 |
| Northwestern | 282 | 307 | 462 |
| Penn St | 351 | 326 | 357 |
| Michigan St | 431 | 377 | 230 |
Horizon
| Top Times as of 1/24/16 | Average Times as of 1/24/16 | Actual Score (w/ diving) | |
| Oakland | 800 | 771 | 840 |
| Cleveland St | 597 | 443 | 597.5 |
| Wright State | 484 | 568 | 585 |
| Illinois-Chicago | 297 | 333 | 399 |
| Wis.- Milwaukee | 477 | 473 | 382.5 |
| Wis.- Green Bay | 310 | 374 | 366 |
| Valparaiso | 0 | 3 | 153 |
Ivy
| Top Times as of 1/24/16 | Average Times as of 1/24/16 | Actual Score (w/ diving) | |
| Princeton | 1243 | 1126 | 1520.5 |
| Harvard | 1123 | 1290 | 1499 |
| Penn | 1379 | 1362 | 1213.5 |
| Yale | 740 | 791 | 836 |
| Cornell | 545 | 474 | 790 |
| Columbia | 469 | 486 | 786.5 |
| Brown | 752 | 753 | 672 |
| Dartmouth | 525 | 494 | 491.5 |
Pac 12
| Top Times as of 1/24/16 | Average Times as of 1/24/16 | Actual Score (w/ diving) | |
| Stanford | 524 | 679 | 808 |
| Southern Cali | 398 | 415 | 700 |
| California | 770 | 706 | 628 |
| Arizona | 633 | 529 | 569 |
| Arizona St | 269 | 326 | 402 |
| Utah | 491 | 430 | 295 |
SEC
| Top Times as of 1/24/16 | Average Times as of 1/24/16 | Actual Score (w/ diving) | |
| Auburn | 923 | 1036 | 1223 |
| Georgia | 1069 | 1120 | 1010 |
| Alabama | 864 | 858 | 915 |
| Florida | 1074 | 889 | 909 |
| Missouri | 904 | 689 | 901 |
| Tennessee | 598 | 649 | 745 |
| South Carolina | 540 | 600 | 574 |
| Texas A&M | 393 | 440 | 532 |
| Kentucky | 286 | 381 | 530 |
| LSU | 495 | 484 | 526 |
Patriot
| Top Times as of 1/24/16 | Average Times as of 1/24/16 | Actual Score (w/ diving) | |
| U.S. Navy | 880 | 862 | 951 |
| Army | 691 | 686 | 650 |
| Boston U | 406 | 434 | 487 |
| Bucknell | 365 | 393 | 469 |
| Loyola (MD) | 266 | 247 | 300 |
| Lehigh | 201 | 252 | 249 |
| Colgate | 225 | 141 | 172 |
| Lafayette | 7 | 20 | 157 |
| Holy Cross | 98 | 95 | 100 |
| American | 146 | 155 | 99 |
WAC
| Top Times as of 1/24/16 | Average Times as of 1/24/16 | Actual Score (w/ diving) | |
| Air Force | 764 | 682 | 717 |
| Wyoming | 579 | 677 | 690 |
| Grand Canyon | 653 | 611 | 650 |
| UNLV | 348 | 335 | 578 |
| North Dakota | 317 | 277 | 344 |
| CSUB | 258 | 313 | 309 |
| Seattle U | 142 | 166 | 183 |
So, essentially this article speaks on the averages of the “top times” vs. “average times”? Hard to validate without knowing how much rest (shaving,suits,etc.) were used for the “top times.” Since most teams don’t fully taper for mid-season meets, those “top times” don’t really show the full story. So i can see why the “average times” are more reliable at this time of the season.
Horizon League is missing Youngstown State.
I believe this is the men’s data