
Courtesy: Steve Gambino.
This is the second of a four-part series taking a look at the current ISL scoring system and the impact made by jackpot points.
Initial analyses of the jackpot system have not been favorable. As we discussed in Part 1, it’s complex, unsuitably named, largely gimmicky, and does not reflect what we ought to value for the highest levels of competitive performance.
Not all Events are Created Equal
The scope of its problems extends further than you may expect. Prior to the introduction of the jackpot bonus, all events were valued equally within their category (IND, REL, SKN). So, for example, a swimmer winning the 100 IM earns the same number of points (9) that a swimmer winning the 200 FR would. This is similarly true between genders; winning Men’s events were valued equivalently to winning Women’s events. I believe this is important, previously writing “If both genders are competing together, they should be valued equally,” as another axiom of a “good” scoring system.
The ISL’s original format satisfied this axiom, as well as preserved equality between individual events. On the surface, it may seem that introducing the jackpot system shouldn’t change this. After all, the opportunity to earn jackpot points is theoretically the same across both genders and different events, right? And each individual event still holds the same 37 points of total value, so aren’t they equivalent? Not exactly. Let’s begin by exploring the differences between individual events.
Within the jackpot system, points are now distributed, in part, based on how the talent is distributed. For an event where a small group of athletes sit far above the rest of the field, the opportunity for those swimmers to earn additional points through jackpotting is high, as is the probability that others will earn little to nothing. For an event in which the athletes’ times are much less spread out, the opportunity to earn additional points is significantly less.
Let’s examine this idea using some more concrete numbers. Here is the distribution of jackpot points earned over the course of the 2020 season (left to right in event order):
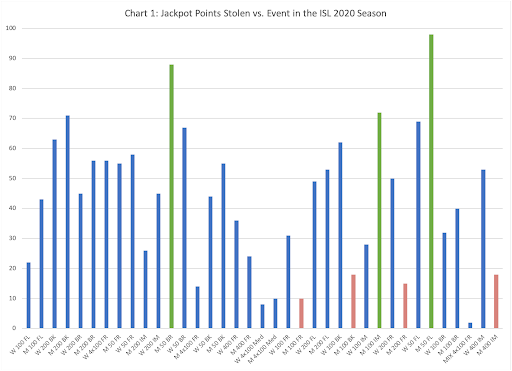
Chart 1 shows the number of points stolen in every event throughout the 2020 season due to the Jackpot Bonus. Focusing our attention solely on the individual events for now, the Men’s 50 FL, 50 BR, and 100 IM are the top three (highlighted in green), earning 98, 88, and 72 jackpot points respectively. Let’s take a closer look at the top event, the 50 FL, as an example:
For the 13 matches of the 2020 season, there were only four different winners of the 50 FL: Caeleb Dressel (3 wins), Takeshi Kawamoto (2), Nicholas Santos (4), and Szebasztian Szabo (4). The winning times span from 21.78 to 22.50 with an average of 22.11. The jackpot margin in this event is 0.90 seconds, so we should expect on average, that a time slower than 23.01, 22.11 + 0.90, will be jackpotted. I’ll refer to this going forward as the average cutoff time. Now let’s compare that with the averages and ranges of each place second through eighth:
| Table 2: 2020 Men’s 50 FL Times by Place | |||
| PLACE | AVERAGE | MIN | MAX |
| 1 | 22.11 | 21.78 | 22.5 |
| 2 | 22.43 | 22.04 | 22.73 |
| 3 | 22.65 | 22.53 | 22.92 |
| 4 | 22.78 | 22.58 | 23.15 |
| 5 | 22.90 | 22.64 | 23.39 |
| 6 | 23.11 | 22.84 | 23.62 |
| 7 | 23.23 | 22.87 | 23.88 |
| 8 | 23.55 | 23.02 | 24.04 |
The times slower than 23.01 are highlighted in red in Table 2. A couple of important observations from the Men’s 50 FL to be used for comparison:
- The season overall average was 22.84, 0.17 seconds faster than the average cutoff time.
- 29.81% of swims were slower than the average cutoff time.
On the other hand, the Men’s 100 FR, 200 FR, and 400 IM/100 BK (tied for 3rd), highlighted in red in Chart 1, are the bottom three events earning only 10, 15, and 18 jackpot points respectively. Using the 100 FR as an example, we’ll see a bit of a different story.
For the 13 matches of the ISL 2020 season, there were five different winners of the 100 FR: Zach Apple (4), Caeleb Dressel (5), Florent Manadou (1), Alessandro Miressi (2), and Blake Pieroni (1). Though still primarily dominated by a small group of guys, the event’s distribution is a lot tighter. The average winning time was 45.94 and spans from 45.08 to 46.53. Since the jackpot margin in this event is 1.80 seconds, we can expect on average that a time slower than 47.74 will be jackpotted.
| Table 3: Men’s 100 FR Times by Place | |||
| RANK | AVERAGE | MIN | MAX |
| 1 | 45.94 | 45.08 | 46.53 |
| 2 | 46.42 | 46.03 | 46.89 |
| 3 | 46.67 | 46.25 | 47.13 |
| 4 | 46.89 | 46.32 | 47.4 |
| 5 | 47.13 | 46.65 | 47.43 |
| 6 | 47.32 | 46.68 | 47.85 |
| 7 | 47.47 | 46.83 | 47.96 |
| 8 | 47.65 | 46.91 | 48.24 |
Again, the times slower than 47.74 are highlighted in red in Table 3, but notice that this time there are a lot fewer instances in the 100 FR compared to the 50 FL. Using the same observations:
- The season overall average was 46.93, 0.81 seconds faster than the average cutoff time. With the event being a little more than twice as long, we would expect this gap to be larger, but in this case, it is disproportionally larger.
- Only 9.71% of swims were greater than the average cutoff time, significantly fewer.
So, while it seems that the opportunity to earn jackpot points is theoretically the same across all events, in actuality, earning jackpot points in the 100 FR was much rarer than in the 50 FL. Someone like Zach Apple, who won 4 times in the 2020 season, has less potential to earn additional points for his wins in the 100 FR than someone like Nicholas Santos has in the 50 FL. This is because the distribution of talent relative to the predetermined jackpot margin is spread a lot wider in the 50 FL than the 100 FR. We can see this on the frequency distribution charts below.
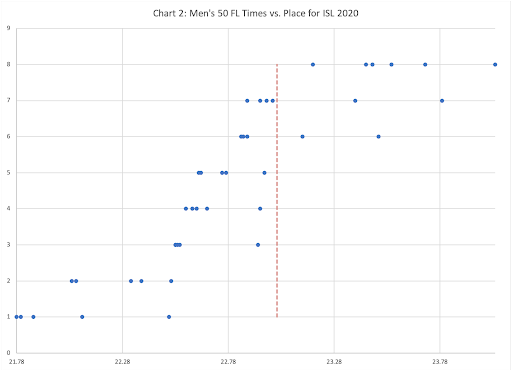

Notice how the overall distributions in Charts 2 and 3 look relatively similar, though the 50 FL seems to be more spread out and have more pronounced tails. The major difference to note is where the red line falls in the distribution. This represents the average cutoff time. In the 100 FR, it is much further to the right, visually demonstrating how the jackpot margin has a less significant impact in this event.
So far, I have illustrated how different events are now valued differently from each other with the jackpot system. As a consequence of this, there also exists the potential for the jackpot bonus to lead to inequalities between genders for a given event. While some events resulted in insignificant differences, other events like the 100 IM, where men out-jackpot women by 44 points, highlight the potential for significant gender discrepancies. Other examples include:
| Table 4: Highlight of Jackpot Discrepancies between Genders | |||
| Event | Men Jackpot Points | Women Jackpot Points | Difference |
| 100 FL | 43 | 22 | M > 21 |
| 50 BR | 88 | 67 | M > 21 |
| 100 FR | 10 | 31 | W > 21 |
| 100 BK | 18 | 62 | W > 44 |
| 100 IM | 28 | 72 | M > 44 |
| 50 FL | 98 | 69 | M > 29 |
| 400 IM | 18 | 53 | W > 35 |
| 4×100 FR RLY | 14 | 56 | W > 42 |
Sometimes these sway in favor of the men, other times they sway in favor of the women. In total, women earned 818 points through the jackpot bonus in 2020, 50 more than the men, who earned 768. This may seem mostly negligible on the whole. However, considering the jackpot margins are assigned different values for each different event, it seems sensible to disaggregate the data by event when determining what the margins ought to be. And there is an observable difference in outcome by event that resulted in discrepancies of points earned by event winners between genders.
So, what does all of this mean? Well, it tells us that the effect of the jackpot is dependent on the distribution of talent in the event, and the specific jackpot margin. Unless the intention was to inflate the value of certain events or deflate the value of others, it is my opinion that the jackpot margin for each event should be determined as a function of the distribution of talent in order to minimize inequality across events and genders. In other words, more care needs to be taken in order to find an ideal jackpot margin for each event that minimizes the potential for discrepancies in value between events or between genders.
Obviously, this does not currently appear to be the case, but begs the question, how is the jackpot margin even determined for an event? Additionally, remembering that the current jackpot margins had no effect on the results of the 2020 season, is it possible that a more carefully chosen margin could make the system less gimmicky and more impactful? Could adjusting the jackpot margins be enough to salvage the system? We’ll continue this investigation in part three.
See Also
ABOUT STEVE GAMBINO
 Steve grew up swimming in Middletown, CT. Before recently moving to Worcester, MA in September, he spent the past five years in Rhode Island, teaching math at CCRI and coaching age group swimming with Crimson Aquatics. Steve has an M.S. in Mathematics from University of Rhode Island, has previously served as a consultant for the ISL for the development of their rating system, and currently works as an Assistant Professor of Mathematics at Quinsigamond Community College in Worcester.
The 2023 Worlds are going to be in November, not during the summer. That means, next season is the last season of this league (specially, since some athletes aren’t even paid from season 2).
During the fall 23, the Pan American Games and SC Europeans are happening as well. That means, there is no time and place for a season 5.
While I agree that the jackpot system could use a rework, I’m not sure this particular critique resonates with me. The main argument seems to be that the distribution of points in each event depends on the distribution of talent in that event.
Importantly, the total number of points scored in each (non-400m) event is the same, regardless of jackpots. If this were not the case, it would cause problems like the post suggests; for instance, if jackpots were just bonus points for the winner, then a weak field could unfairly add extra points to the event. Conversely, if the points from jackpotted swimmers were simply lost, then a strong front-runner could unfairly decrease the points in the event. But… Read more »
Who cares about event equality. Just because swimmer X is disproportionately better than everyone else does not mean they should be punished for it, it should be championed. Likewise, if swimmers are close and there are no outliers, it incentivizes the advancement of the event. Trying to make it fair is a never-ending game of chasing your own tail, if you want to make it fair then they should just axe the jackpots.
Should Steph Curry get fewer points for every 3 he makes because he gets more opportunities to shoot them than his competitors?
This is a fair point – I did operate from an assumption that fair is better without justification. Hopefully I can clarify.
The ISL does not necessarily need to value event fairness. In fact, it could be the case that it was intentional to inflate the value for winning certain events over others. It is their prerogative whether to aim for equality or not, and adjust their scoring system accordingly. Perhaps, for example, winning the 50 FL ought to be worth more points than winning the 100 FR? If so, then the jackpot succeeds in this respect.
Personally though, I would prefer event equality (but totally respect your pov if you disagree). Here are a few reasons:
1) The points earned by a swimmer factor into… Read more »