As we approach the end of the collegiate swim season, the time comes to crown a new national champion. The past few years at SwimSwam, we have tried to help our readers get a picture of what the pre-nationals team standings look like and how the national championship meet is shaping up by simulating national championships during the middle of the season. We have based these simulations on the top times swum so far that season. While fun and helpful in understanding how teams have swum so far that year, these simulated national championships unfortunately aren’t actually all that accurate in terms of predicting who the national champion will be, especially when compared to some more basic predictions.
Shown below is a plot of DI nationals – both the men and women – score prediction accuracy for the years 2015-2018 using two different prediction techniques. The grey line shows the accuracy of taking the previous year’s nationals results, removing all the seniors, and re-scoring. The blue line shows how accurate the nationals prediction using the top times swum so far that year is. Both are plotted against the number of weeks into the season, using October 15 as a week 0 start date. To help make sense what the number of weeks means, know that pretty much all of the mid-season tapers finish by 8 weeks into the season – Dec 15 – most of the conference championships wrap up around 20-21 weeks – early March – and nationals is usually around 24 weeks in – April 1.
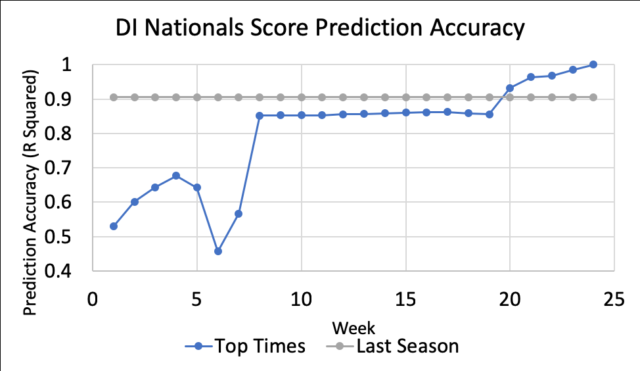
D1 nationals predictions. Top times prediction method vs. using previous season’s scores
The graph shows that nationals predictions using top times swum so far that year are pretty crap for the first 7 weeks of the season. And they still aren’t more accurate than just using last year’s times until 20 weeks into the season! The prediction using top times is of course perfectly accurate after the nationals meet has already been swum – 24 weeks into the season. One odd feature of the graph is that the predictions actually start to become less accurate 6-7 weeks into the season. At this point, only half of the teams have swum mid-season tapers, so the teams that have tapered look way faster than the teams that have not.
It doesn’t make sense to use the season’s top times as a way to predict the nationals until after the conference championships are complete, which is like 80% of the season! As swim fans, we would love a way to incorporate the new results into the team’s rankings without being overly reliant on them. Keeping this in mind, I set out to build a model for nationals swimming results using swimmer’s times from the current and previous seasons. To predict the team results, I first created a model that would predict individual swimmer’s taper times and then simulated a virtual national championship meet based off of those times.
Since the current season’s top time becomes more predictive of their taper time as the season goes on, I created a different set of weights for each week of the season. Early in the season, top times from previous years carried most of the weight, about 90%. Top times after mid-season tapers were weighted about 50-50 with previous season best times and times done after conference championships were weighted about 80%.
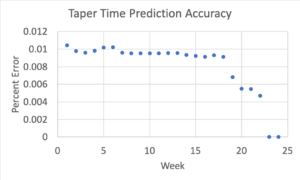
Individual times predictions with new model
Using the predicted swimmer’s taper times, I then simulated the national championships. I’ve shown the accuracy of the results below. The new “predicted times” trendline shows how the new predictions stack up against the previous models. They initially start a bit worse than a prediction using last year’s times, but after conference championships they are far better than either previous prediction metric and continue to be up into the end of the season.
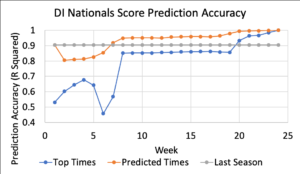
Old D1 Nationals score predictions compared to new model
You can see how the predictions actually performed from the below tables comparing the pre-season nationals score predictions, the new model, and the actual scores*.
*Please note that the scores here will not match the actual scores of the NCAA meet due to not including diving and scoring using the faster of prelims and final swims. USA Swimming doesn’t distinguish between the two.
Shown below are 2018 top ten DI men’s teams with predicted nationals scores:
| Team | Pre-season Prediction | Model | Actual Score* |
| California | 327 | 453 | 434 |
| NC State | 266 | 250 | 388 |
| Texas | 409 | 445 | 372 |
| Florida | 317 | 306 | 343 |
| Indiana | 247 | 292 | 325 |
| Southern Cali | 215 | 247 | 225 |
| Stanford | 230 | 197 | 210 |
| Michigan | 145 | 170 | 157 |
| Louisville | 136 | 180 | 133 |
| Auburn | 97 | 175 | 130 |
And here are the 2018 top ten DI women’s teams with predicted nationals scores:
| Team | Pre-season Prediction | Model | Actual Score* |
| Stanford | 405 | 572 | 605 |
| California | 400 | 429 | 352 |
| Texas A&M | 293 | 230 | 318 |
| Michigan | 217 | 224 | 270 |
| Tennessee | 97 | 133 | 212 |
| Louisville | 154 | 194 | 210 |
| Texas | 206 | 266 | 177 |
| Southern Cali | 253 | 227 | 172 |
| Virginia | 86 | 96 | 148 |
| Indiana | 139 | 144 | 126 |
2019 Predictions
And finally – drumroll please – the predictions for 2019 with times through 3/11/2019 for the Division I men:
NOTE: This scoring is based on swimming ONLY. For teams, most significantly the Texas men, who are expecting diving points, the actual scoring will be higher. We’re still pondering how to best develop a Divulator.
| California | 442 |
| Texas | 330 |
| Indiana | 318 |
| NC State | 259 |
| Florida | 234 |
| Michigan | 207 |
| Missouri | 171 |
| Alabama | 166 |
| Tennessee | 145 |
| Louisville | 131 |
For the Division I women:
| Stanford | 381 |
| California | 361 |
| Michigan | 315.5 |
| NC State | 253 |
| Tennessee | 246 |
| Southern Cali | 197 |
| Indiana | 196 |
| Auburn | 193.5 |
| Texas | 192 |
| Louisville | 166 |
Keep in mind – Texas fans in particular – that diving isn’t included here, so teams with strong diving programs should see a bump in their scores for the actual national championships. We have incorporated these predictions into the team rankings page at the Swimulator. The nationals win percentages are based upon this new model. If you’re interested check them out as they are updated weekly throughout the season.
Why is diving not factored in this simulation? It’s called NCAA swimming & DIVING championships for a reason its a team effort you cannot have one without the other and factoring in diving would make it more accurate.
Impressive Kevin!
Have you thought about trying machine learning? I’d be curious to see how this compares to the results from the model you’ve built (which looks to perform quite well).
I feel like this only really works and does a good job of predicting the top 2-3 teams… those with a larger presence at the meet and larger sample size or more room for error in their scores….. ie someone seeded 1st or 2nd gets 10th, but someone seeded 9th moves up to 5th and it almost seems like a wash. That works for the teams with more swims or more athletes at the meet. After that I dont think it does a good job just because there is way more volatility in the scores at that point. For example, a team in the 25-30 range scoring 10 more points could make their standing jump 5 places, but at the… Read more »
This is sweet. Thanks!
Unrelated, can we get a refresher on relay qualifiers for ncaas? Can teams send whoever they want for relays, or just the swimmers on their qualifying relays?
They can send anyone. Many don’t ever swim when at meet and there was no intention for them to swim. More of a reward system
4 people for the relay and 2 alternates. I believe the alternates count towards you team total.
The most accurate “divulator” model would ignore everything except each qualifier’s score in the finals, at the five zone qualifiers for the current year, then simply rank the divers predicted finsih for the current year based on those scores. You could probably get divemeets.com to provide the data. It would be very easy for them to do.
I’ve looked into that. I have worried that diving scores aren’t perfectly consistent across regions; I know that to qualify nationals the scores are re-judged by a single committee.
Just to add to your analysis. You can’t use R^2 as a performance matrix in classifications problems, as R^2 only tells you how much of the variability in the data the given model captures. Instead, take a look at confusion matrices and AUC curves as predicting a place at a meet is a categorical problem.
Also, thank you for adding this analysis!
The R^2s that are discussed here aren’t applied to place at a meet. They are applied to the model’s prediction of Score. Now score isn’t exactly a continuous variable because it’s integers, but with a 0-500ish possible range treating it as a non categorical variable isn’t unreasonable.
Stanford women don’t even make the top nine with these predictions, there’s no way their diving is really that significant??
Stanford is first in bold
They are first with 381.
Hahaha, I was tricked at first too looking at this… I missed the bold team for both men and women at first glance.
How do you do relays year-to-year when there are seniors on last year’s relay?
The same way I do individual times for now. It tends to be only slightly less accurate than for the individual times overall. I’m looking into doing add-up relays for the 400 Medley, 400 Free, and 800 Free relays, after predicting the individual times, but I don’t think approach will work as well for the 200 yard relays.