
With the first stop of the World Cup in Carmel concluded, we recently posted the current standings in terms of both ranking points and money earned. After Carmel, Gretchen Walsh leads Kate Douglass in ranking points, but only by a very small margin — 59.1 to 58.9. The size of that margin was very surprising to me, so I wanted to take the time to understand why.Points are earned in two ways: by position and by performance.
- By position: 10 points for 1st, 8 points for 2nd, and then 6 pts down to 1 for 3rd through 8th place.
- By performance: Each time is converted into World Aquatics points — based on the formula (R / T) cubed, where T is the time and R is the previous year’s world record. This value is then floored by 10 and divided by 10.
The example given in World Aquatics’ document is that a woman placing 2nd in the 100m fly with a time of 55.49 would earn 17.2 points: 8 points for the 2nd place finish and 9.2 for the 924 points of the swim.
Only a swimmer’s best three events contribute to their totat al each stop. For Walsh and Douglass, they each won 3 events, which contributed 30 points each. Removing that, Walsh earned 29.1 performance points to Douglass’ 28.9. Does that seem reasonable?
Let’s take a look at their actual performances (I’m including Douglass’ 100 IM for completeness, even though she didn’t win it)
| Swimmer | Event | Time | Aqua |
| Gretchen Walsh | 50 Fly | 23.72 | 1028 |
| Kate Douglass | 100 Breast | 1:02.90 | 974 |
| Kate Douglass | 200 Breast | 2:13.97 | 967 |
| Kate Douglass | 100 Free | 50.83 | 966 |
| Gretchen Walsh | 100 IM | 55.91 | 957 |
| Gretchen Walsh | 100 Fly | 53.69 | 946 |
| Kate Douglass | 100 IM | 56.34 | 935 |
This order seems… surprising? World Aquatics points, as a metric, have some advantages. They are very easy to calculate, since you only need two numbers (the previous year’s world record and the current time). It also makes it easy to compare times across eras, as a sort of normalization. However, it has some notable disadvantages as a metric as well — which might be clear from the ordering above.
Douglass’ 1:02.90 in the 100 breast is the 26th fastest performance of all-time and makes her the 6th fastest performer in the event, but her 2:13.97 in the 200 breast is the 3rd fastest performance of all-time, and only she has been faster. I would consider the latter to be an objectively better swim.
On top of that, we have to go down the World Aquatics list pretty far to get to Walsh’s 100 fly — she only got 946 points for an effort that is also the 3rd fastest performance of all-time, simply because her own world record in that event is so comically absurd. Is that really a worse swim than Douglass’ 50.83, that ranks as the 13th fastest performance and would make her the 7th fastest performer (were she not already higher on the list)? No.
By only normalizing based on the previous world record, World Aquatics penalizes great records (like Douglass’ 200 breast and Walsh’s… everything) and rewards events that are more competitive (like the 100 free and 100 breast).
What if we did something different? Another way of normalizing across events and time is using z-score. What if we calculated every event based on first determining the mean and standard deviation of the 100 best performers (not performances) in the event, and then used those values to compute the z-score of the given swim? That is, the distribution we’re looking at is the best times of the 100 fastest swimmers — not the 100 fastest times.
For example, in the women’s 50 fly, the mean is 25.52 and the standard deviation is 0.43, so Walsh’s 23.72 would be a z-score of 4.16 (well, it’d really be negative, but let’s just flip the sign). If we do the same calculation for all seven swims and order them by z-score instead, we get:
| Swimmer | Event | Time | Aqua | Z Score |
| Gretchen Walsh | 50 Fly | 23.72 | 1028 | 4.16 |
| Gretchen Walsh | 100 Fly | 53.69 | 946 | 3.53 |
| Gretchen Walsh | 100 IM | 55.91 | 957 | 3.52 |
| Kate Douglass | 200 Breast | 2:13.97 | 967 | 3.18 |
| Kate Douglass | 100 IM | 56.34 | 935 | 3.04 |
| Kate Douglass | 100 Breast | 1:02.90 | 974 | 2.46 |
| Kate Douglass | 100 Free | 50.83 | 966 | 2.41 |
This ordering makes significantly more sense to me. All of Gretchen Walsh’s swims, as well as Kate Douglass’ 200 breast, are faster than anybody but them as gone, and Douglass’ 100 IM was the fastest performance by somebody not named Gretchen Walsh. All of those are clearly better performances than Douglass’ 100 breast and 100 free.
With this metric as-is, Walsh would score 11.21 performance points to Douglass’ 8.05 (her 100 IM scores more performance points than her 100 free — but if we account for position, her 100 free gives her 12.41 while her 100 IM gives her 11.04).
That gap makes far more sense to me. Douglass had a great performance in Carmel, but Gretchen Walsh’s was, nevertheless, distinctly better.
Two other notable differences in quality of performance rating also come on the women’s side courtesy of Alexandria Perkins’s 2nd place swim in the 100 fly (54.93) and Roos Vanotterdijk’s 3rd place swim in the 100 IM (57.44). Both of these scored 883 AQUA points, which doesn’t seem like a particularly impressive outing. Yet that makes Perkins the 8th fastest performer (with the 16th fastest time) and Vanotterdijk the 7th fastest performer (with the 46th fastest time). A Z-score based system reflects that better:
| Swimmer | Event | Time | Aqua | Z Score |
| Alexandria Perkins | 100 Fly | 54.93 | 883 (T-52nd) | 2.05 (18th) |
| Roos Vanotterdijk | 100 IM | 57.44 | 883 (T-52nd) | 1.84 (23rd) |
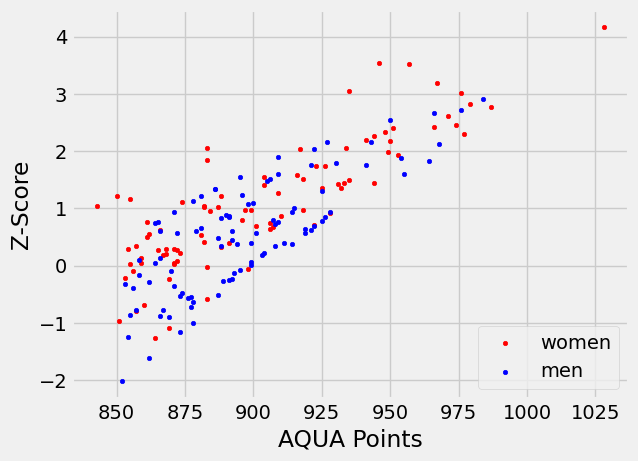
Here is what the full distribution looks like, if we consider all of the finals swims that scored either at least 850 AQUA points or had a Z-score of at least 1. The two values are, unsurprisingly, quite correlated. The sixth swim here with a Z-score of at least 3 was Regan Smith’s 200 fly time of 2:00.28, which scored 976 AQUA points with a Z-score of 3.02.
Should World Aquatics change to use a Z-score-based system instead of World Aquatics points? We’d still need to figure out how to properly scale the z-scores so they have the same level of impact. But I think, as a starting point, I think such a system would significantly more accurately reflect the relative performances of different athletes.
Back in the day performance points were based on the average of the top 8 swims. Not sure when it went back to just the record. I do like the z score idea.
Marsha marsha marsha.
Same with Ledecky getting snubbed for a multitude of awards because she only swam the 11th fastest time in history or something
Yes- Z-score makes much more sense to show the clear superiority of a given swimmers performance- will not penalize a given swimmer if they are in essence attempting to improve upon their own standards.
Also they are undervaluing all the swimmers with the prize money. What about some inflation adjustment or higher bonuses instead of wasting money in Hungary on their stupid building
Walsh Fatigue is real.
Alternatively, this is the most unrequited headline SwimSwam has ever written.
“I’d treat her so much better, they don’t appreciate her like I do. If only she could see!!!”
This guy gets it.
I would make a 1000 pt swim be equal to the avg. time of the top 3 performers in the last 24 months. It would dilute the world records effect a little bit and give that swimmer the boost in point they deserve. It also throws out outlier swims that occurred in the past.