We asked our swimming data partner TritonWear to help us with a deeper insight into performances and what makes elite swimmers fast and where they can improve. This is their TritonWear analysis.
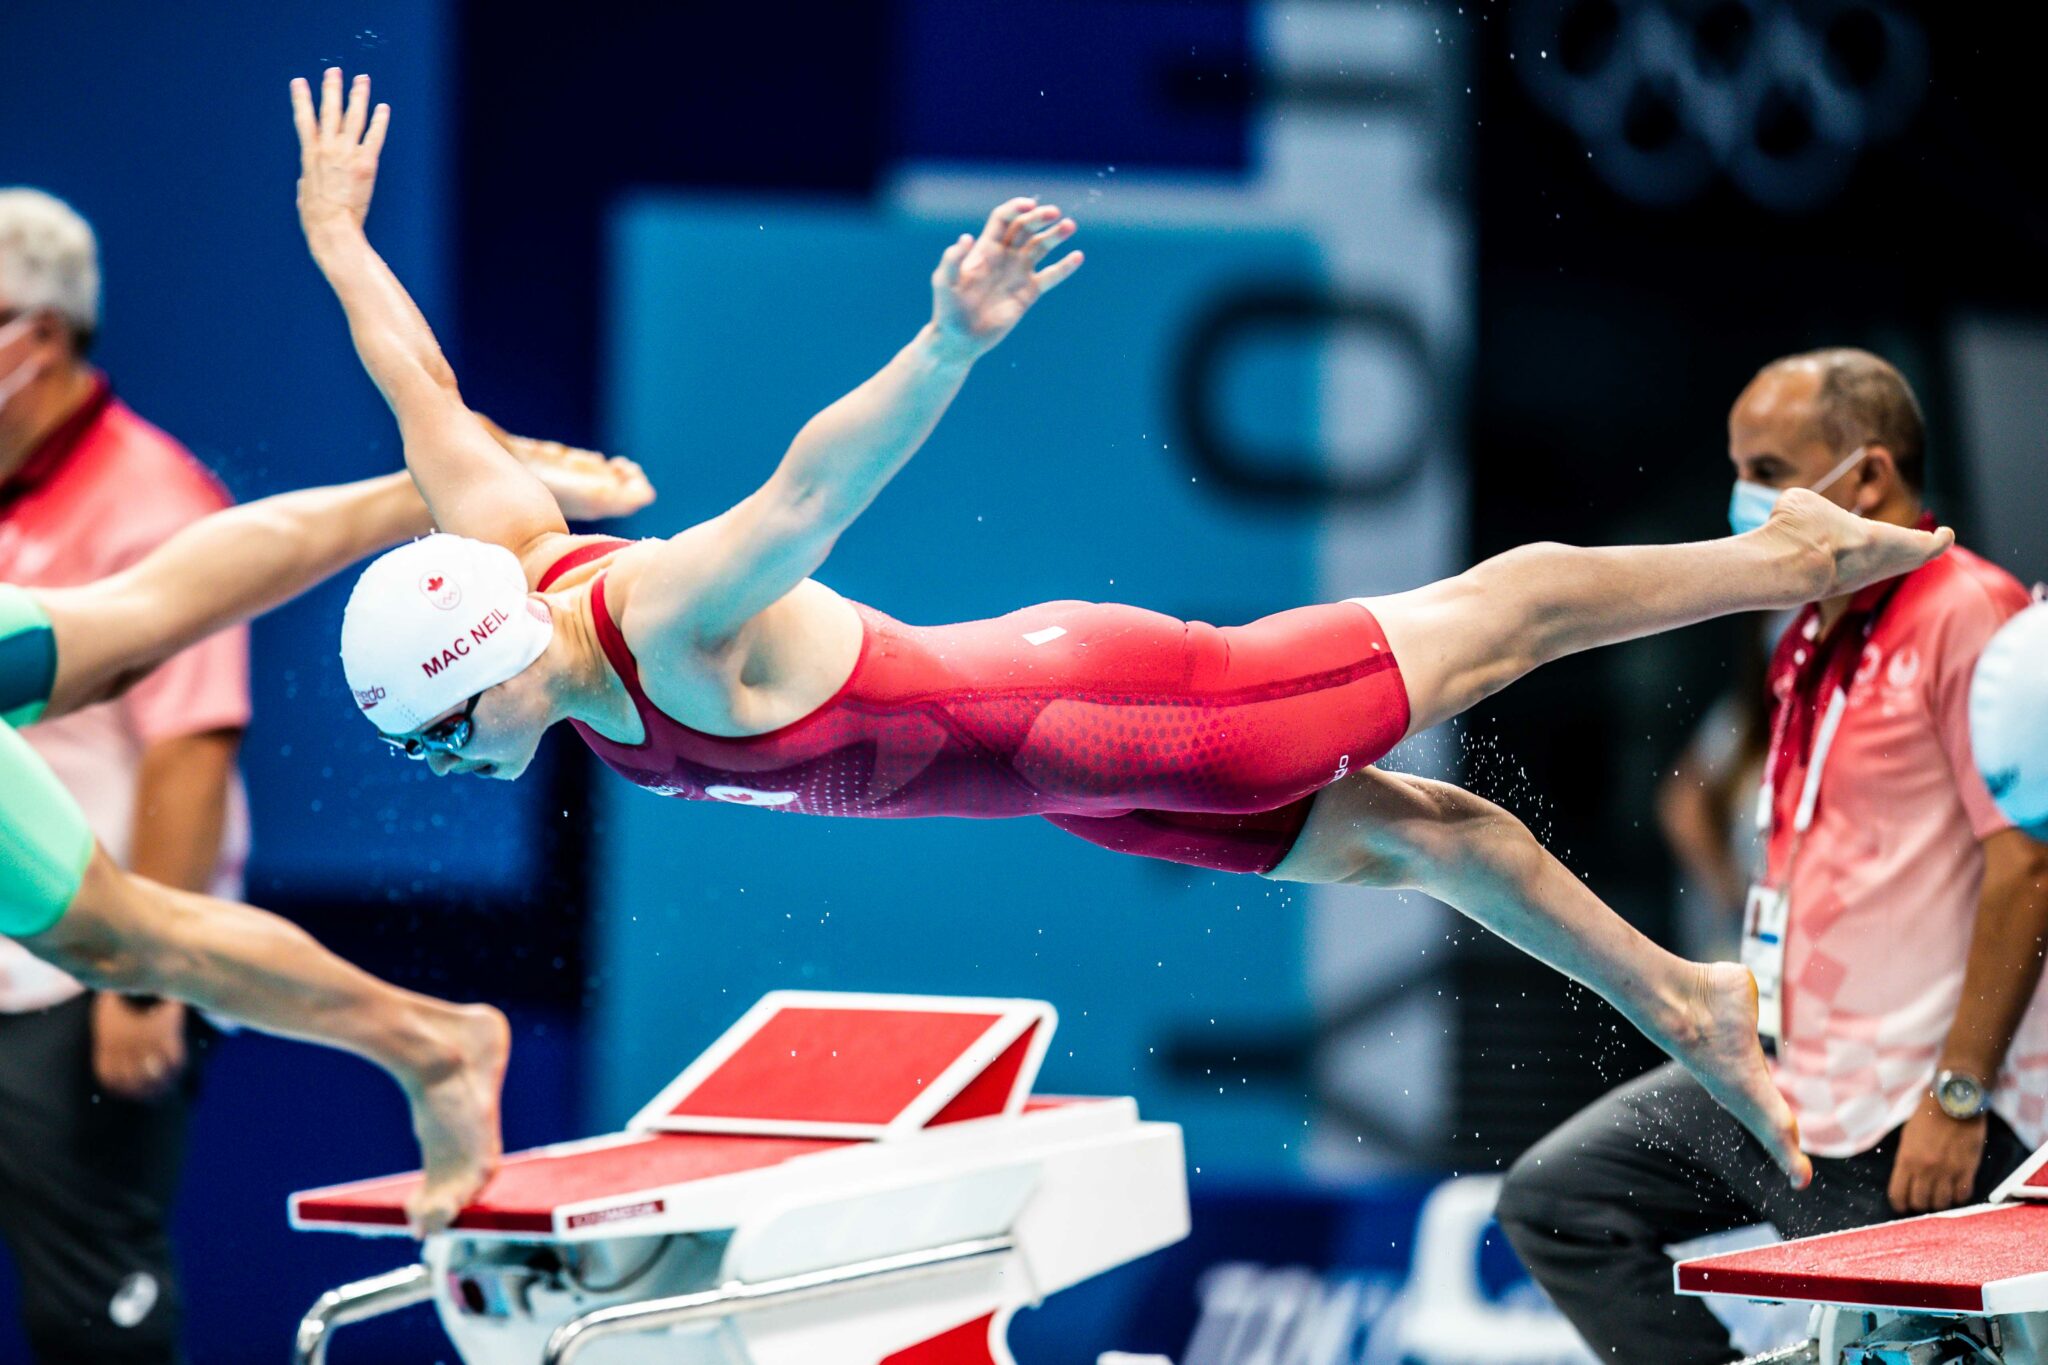
Maggie MacNeil went on a hunt on the second lap of the 100 Butterfly and brought it home for Canada with an incredible 55.59 and the third-fastest time in the world. Winning caught her by surprise as she took a moment to look at the scoreboard before she realized she was crowned champion and the first Gold for Canada in Tokyo.
Her world title from two years ago in Gwangju, South Korea, meant she had a target on her back going in, but a well-executed strategy catapulted her to the top. Although 7th on the wall for the first lap of the race, MacNeil stormed down on the second 50, a so-called ‘’sweet spot’’ of hers.
What’s clear is that Swimming Canada’s dedication to data is leading the team back to the podium for 2021. Without further ado, let’s get into the nitty-gritty of data and show you how to pull ‘’a Maggie MacNeil’’.
 Nerd alert: we love data; so we’re bringing you the same TritonWear data 30+ national federations trust when training elite athletes, to explore the world’s best races and bring you all the insights into faster swimming.
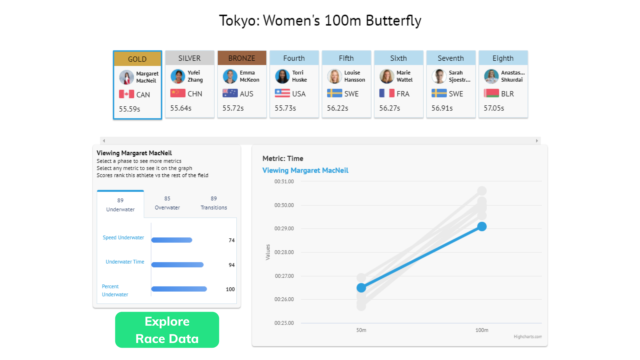
But first, here’s a quick look into the rankings:
1st: Margaret MacNeil Lane 7 – 55.59
2nd: Yufei Zhang Lane 4 – 55.64
3rd: Emma McKeon Lane 3 – 55.72
4th: Torri Huske Lane 2 – 55.73
5th: Lousie Hansson Lane 1 – 56.22
6th: Marie Wattel Lane 5 – 56.27
7th: Sarah Sjoestroem Lane 6 – 56.91
8th: Anastasiya Shkurdai Lane – 57.05
Unlocking performance with TritonWear
Right from the start of the race, the data shows that McNeil left nothing to chance and put in a lot of detailed work to perfect each phase of her swim. In detail, Maggie had the fastest reaction with a Dive Block Time of 0.63s. She truly mastered her start by pairing a fast reaction time with the longest Dive Hang Time 0.4s in the field, covering a lot of distance in the air.
Here’s how to read the graphs below. Each circle represents a swimmer in the race, with the size representing their finishing place. So, MacNeil is the smallest bubble shown here. The green bar on the box is the average across all the athletes in the race.
 Although her speed underwater may not have been the fastest, she spent the most time underwater (4.88s) and percent underwater (18.7%) out of all the finalists in this race. This allowed her to spend less time fighting overwater friction and thus go less on her arms and legs for her swim.
 Her easy speed on the first 50 is reflected in her Stroke Rate (average of 56.98 cyc/min) and Distance Per Cycle (1.79m). Interestingly MacNeil was not the highest scorer on either of the two; she did however balance her SR and DPC beautifully. The truth is that swimming fast is often about mastering metric tradeoffs. Looking at the overwater speed, McKeon was fastest with 1.77 m/s, and MacNeil third after Huske with 1.74 m/s.

As for silver medalist Yufei Zhang, it was the overwater swimming that cost her the gold. Zhang favoured her SR (57.3 cyc/min) too much and ended up trading it off for a lower DPC (1.77m). While McKeon mastered the overwater speed, she lost momentum on her transitions, especially on her starts and turns.
So how does one pull ‘’a Maggie Macneil’’?
One of the biggest takeaways from MacNeil’s analysis is that she held a high SR on the 2nd lap, giving up some SR on the first to reserve energy, overtake the second lap and bring it home. This is also evident through her average speed, where she managed to balance it well between her first (1.89 m/s) and second 50 (1,72 m/s).
She did this by playing to her strengths and weaknesses. And the truth is that what works for her does not mean it will work for you too. The cool thing about data is that you can discover your own path to swimming faster. And it starts with tracking your training and understanding your performance for each phase of your swim (transitions, underwater, overwater)
Draw Your own Conclusions
Head over to TritonWear’s epic Race Analysis page
to explore every detail of each swimmer’s race data.
How TritonWear Can Help You Swim Faster
TritonWear is a sleek wearable device and app that helps you train well consistently, so you can swim faster. It captures and relays 30+ data points in real-time to any mobile device on deck. Triton Score analyzes your data and provides you with actionable insights highlighting exactly where you’re excelling and what you need to improve on to swim faster.
Athletes: Get started with as little as $20/month and receive a free unit (included with your membership).
Coaches: Create highly personalized winning strategies for individual swimmers and the team as a whole with data-driven insights. 30+ national federations trust us to help them train these elite athletes, you can too. * Volume prices apply.

Here’s my analysis of Maggie McNeal’s race. She stares at stress and pressure in the face and then swims her rear end off and beats all the so-called “favorites”. She is a fearless competitor in every sense of the word and her win came as no surprise to me. Maggie
is a BAD A**!
What determines Y-axis positioning on the first two sets of graphs?
Great Question!
The size of each circle correlates to the finish position (1st is smallest, 8th is largest).
The y-axis position is determined by the final race time, with the fastest at the top and slowest at the bottom.