
Courtesy: Steve Gambino
The sport of swimming is in the midst of notable change. At a macro level, it feels as though a lot has happened in just the past few months with regards to how the sport is structured and presented. USA Swimming has added semifinals to its Pro Swim Series meets. NIL has continued to reshape the economic dynamics of college athletics. The Enhanced Games emerged backed by significant private investment, attempting to disrupt with unprecedented athlete payouts and controversial policies permitting performance enhancing drugs. And alternative league models, from rumors of an ISL return to announcements of new college-based variant CSL, are again part of the conversation.
While it may be years before we fully understand the scope and impact of many of these changes, there is at least one whose effects we’ll be able to see within the next month. The 2026 NCAA championships will operate under a revised format featuring several notable alterations from prior years: new qualification standards, a reworked event schedule, and – what we’ll focus on here – a change to their scoring system. Specifically, the elimination of the B-Final.
In prior years, the top 16 swimmers in each event from the morning preliminary session advanced to an evening final. The top 8 athletes competed in the “A-Final”, earning points for their teams based on their finishing place (20-17-16-15-14-13-12-11). Swimmers placing 9-16 competed in the “B-Final” for fewer points (9-7-6-5-4-3-2-1).
Under the new format, places 1-8 will still be determined and scored through the A-Final. However, athletes placing 9-16 will no longer get a second swim at night. Instead, points will now be assigned based on their preliminary rankings.
On the surface, this feels like a significant departure from tradition. Proponents argue that this change should improve the spectator experience, as well as make the meet more broadcast-friendly and more accessible for casual fans. However, critics emphasize the loss for athletes who would have previously earned the opportunity for a second swim.
Missy Franklin articulated this perspective on her podcast: “I am just heartbroken for athletes nine through sixteen. To make a final at an NCAA championship, whether it is A or B, is so exciting because you are scoring points for your team…We’re trading in the excitement [of] the audience and the people watching for the excitement of the athletes and that is why I had such a big issue with it.”
Others, including Caleb Dressel, feel differently. In a candid reaction to hearing the news on the SwimSwam podcast, he said, “Ok, this might be super controversial – why is there a B-Final? What are we doing?” Continuing, he added, “I love that idea. I think that’s how it should be. Here’s the 8 guys competing for who’s the best in the country. I don’t think there should be a B-Final at all.”
Both viewpoints have merit, and the broader questions around format and athlete experience are complex. I won’t aim to resolve all of them here, but there is one specific facet of the discussion that we can address if we examine the data: To what extent do B-Finals matter to the overall team outcomes? How could this change affect the scoring?
The Data
To make this determination, we’ll be relying on historical data sourced from SwimSwam’s Results Archive, specifically Men’s and Women’s Division I Championships results from 2016 through 2025. (Note: 2020 is excluded since the meet was cancelled due to the pandemic. So, this is 9 years and 18 meets.)
It is worth noting that for meets prior to the pandemic (2016 – 2019) there were prelims for some relay events. After the pandemic (2021-2025), all relays were swum as timed finals. Since the current system does not include prelims for relays, the application of the new scoring system (scoring 9-16 from prelim results) will apply only to individual events for this analysis.
It may also be worth noting that there were 5 instances where swimmers placing outside the top 16 in prelims competed and scored points in finals. This typically happens if one of the originally ranked athletes is unable to perform and the 17th or 18th place athlete steps in as an alternate. These cases were scored the same as the others, meaning those alternate athletes who placed under the old system did not score under the new system. This had minimal impact, but notably, for Emma Roush of UMass, her 2 points scored in the 1 MTR diving represented the school’s only points, so they no longer score under the new system.
How much do the team ranks change?
To start, the most direct way we can answer our question of how much B-Finals matter is to examine by how many places teams change if we rescore the meet using the new system. Across all teams from all years, we can get a quick summary, and visualize on a histogram.
Table 1: Summary of Rank Changes from Original Scoring to New Scoring Across All Teams at All Meets
| Average Change | Median Change | Largest Improvement | Largest Drop | |
| Rank Change | 1.02 | 0.639 | +11 | -9 |
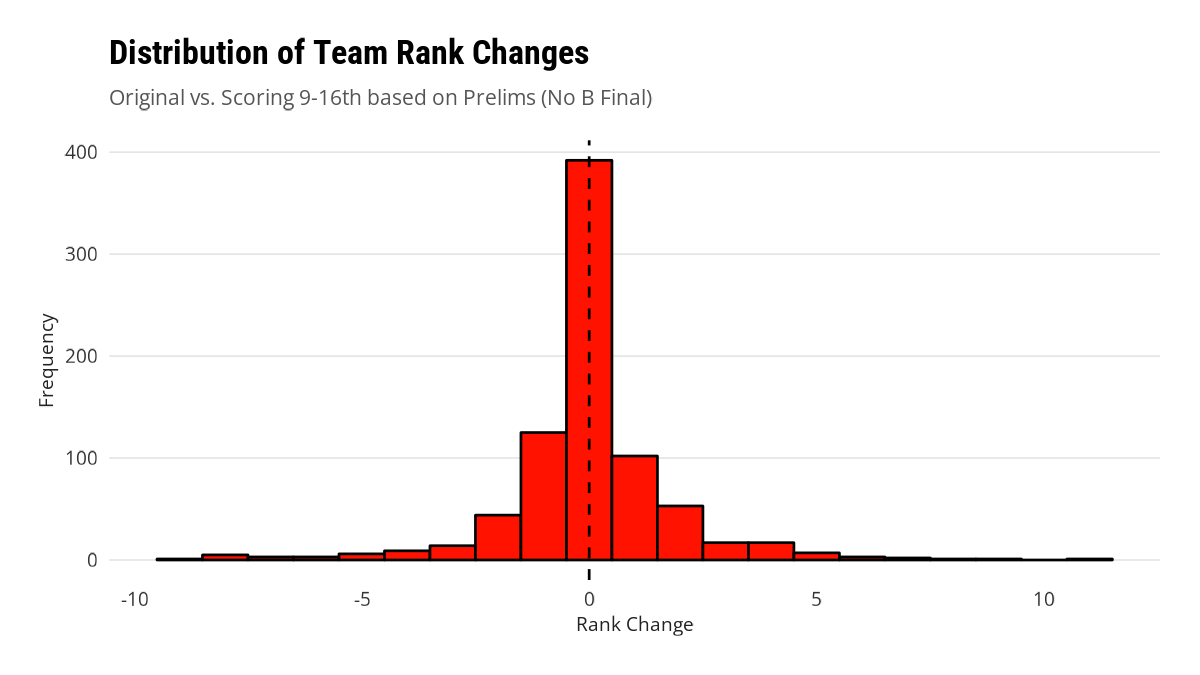
We can observe that in general, across the 806 total team results, the majority of teams are not shifting places much, with an average change of just over 1 spot. 392 teams (49%) maintain exactly the same finish place, while 619 (77%) shift by at most 1 place. This tells us that for the majority of programs, the new system won’t dramatically rewrite where they finish on the scoreboard.
However, there are still a few notable outliers – a max drop of 9 places and a max improvement of 11. That feels pretty substantial, so let’s explore further. The following table represents all teams whose ranking shifted by more than 5 places.
Table 2: Top 20 Teams by Highest Rank Change under New System
| Year | Gender | Team | Original Format Score | Original Format Rank | New Format Score | New Format Rank | Rank Change | Score Change (Original vs New) |
| 2016 | Men | LSU | 6 | 40 | 15 | 29 | 11 | 9 |
| 2024 | Women | MIAMI (OHIO) | 6 | 32 | 1.5 | 41 | -9 | -4.5 |
| 2017 | Women | DUKE | 1 | 47 | 7 | 38 | 9 | 6 |
| 2024 | Women | KANSAS | 6 | 32 | 2 | 40 | -8 | -4 |
| 2024 | Women | WASHINGTON ST. | 3 | 40 | 9 | 32 | 8 | 6 |
| 2019 | Men | MISSOURI ST | 7 | 36 | 1.5 | 44 | -8 | -5.5 |
| 2017 | Women | AIR FORCE (W) | 5 | 39 | 1 | 47 | -8 | -4 |
| 2017 | Women | MIAMI (FL) | 5 | 39 | 1 | 47 | -8 | -4 |
| 2016 | Women | MIAMI (FL) | 6 | 40 | 1 | 48 | -8 | -5 |
| 2025 | Men | MINNESOTA | 16 | 28 | 9.5 | 35 | -7 | -6.5 |
| 2019 | Men | NOTRE DAME | 7 | 36 | 2.5 | 43 | -7 | -4.5 |
| 2017 | Women | NEBRASKA | 15 | 33 | 28 | 26 | 7 | 13 |
| 2017 | Women | PENN ST | 10 | 36 | 3 | 43 | -7 | -7 |
| 2016 | Women | RUTGERS | 1 | 47 | 5 | 40 | 7 | 4 |
| 2024 | Women | NOTRE DAME | 6 | 32 | 3 | 38 | -6 | -3 |
| 2022 | Women | TEXAS A&M | 1 | 39 | 6 | 33 | 6 | 5 |
| 2021 | Women | LSU | 9 | 30 | 1 | 36 | -6 | -8 |
| 2018 | Men | MISSOURI | 29 | 23 | 24.5 | 29 | -6 | -4.5 |
| 2018 | Men | OHIO STATE | 25 | 28 | 31.5 | 22 | 6 | 6.5 |
| 2016 | Men | GEORGIA TECH | 8 | 37 | 13 | 31 | 6 | 5 |
Of these 20 teams – roughly 2.5% of all performances – many are cases where a team dropped a number of spots due to most or all of their points coming from B-Finalists. For those teams, their athletes stepped up in the finals and scored more points for their teams than they would have if the results were taken from prelims.
For instance, consider Miami (Ohio)’s 2024 women’s team, which ranks 9 places higher under the old system. This change is based on their sole swimmer, Nicole Maier. Her prelim performance in the 400 IM earned her 15th place in prelims, and would score her team’s only 2 points under the new system. Her swim in the B-Final, however, jumped her up 4 places to 11th, actually earning 6 points. Amongst a field where 11 teams totaled between 3 to 6 points at that meet, her B-Final swim was very consequential in the rankings list. This example highlights part of what Missy is speaking to when she mentions the value that having B-Finals provides to those athletes who are allowed the opportunity to step up and compete for their teams in the big moments.
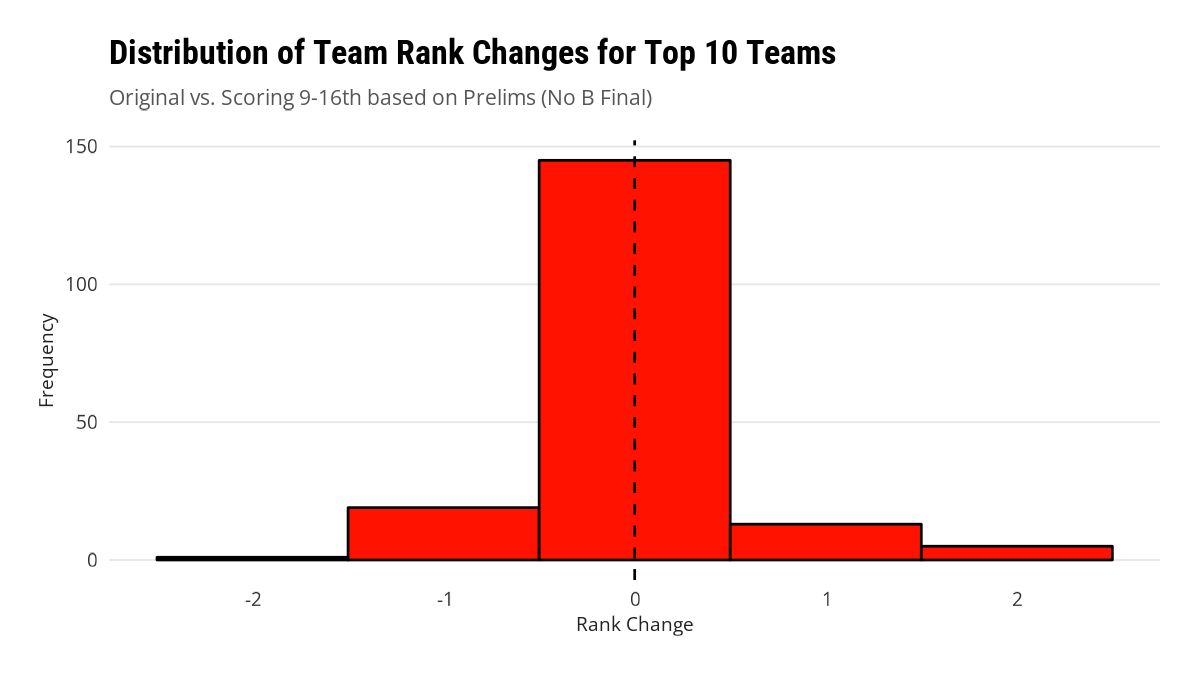
However, looking back across the list of outliers in Table 2, we can observe that they are all fairly low ranked teams. This makes sense – that programs with fewer athletes scoring fewer points amongst a collection of more tightly-packed teams at the bottom of the standings would have the largest amount of variance in placing. The 3-point window for 11 teams at the Women’s 2024 Championships is the quintessential example of this. Notably, the highest ranked team on this list is the 23rd ranked 2018 Missouri Men’s team. When it comes to the big stage and a shift towards aiming to be more broadcast-friendly, you could argue that the primary focus should be on the top 10, or even top 5 teams. With a max ranking of 23rd, this set of outliers may not capture what’s most important. So, how much variation in rankings do we see among the top teams?
Amongst the top 10:
Table 3: Summary of Rank Changes from Original Scoring to New Scoring Across Top 10 Teams at All Meets
| Average Change | Largest Improvement | Largest Drop | |
| Rank Change | 0.240 | +2 | -2 |
| Score Change | 3.68 | +27 | -23 |
And amongst the top 5:
Table 4: Summary of Rank Changes from Original Scoring to New Scoring Across Top 5 Teams at All Meets
| Average Change | Largest Improvement | Largest Drop | |
| Rank Change | 0.20 | +2 | -1 |
| Score Change | 3.68 | +27 | -23 |
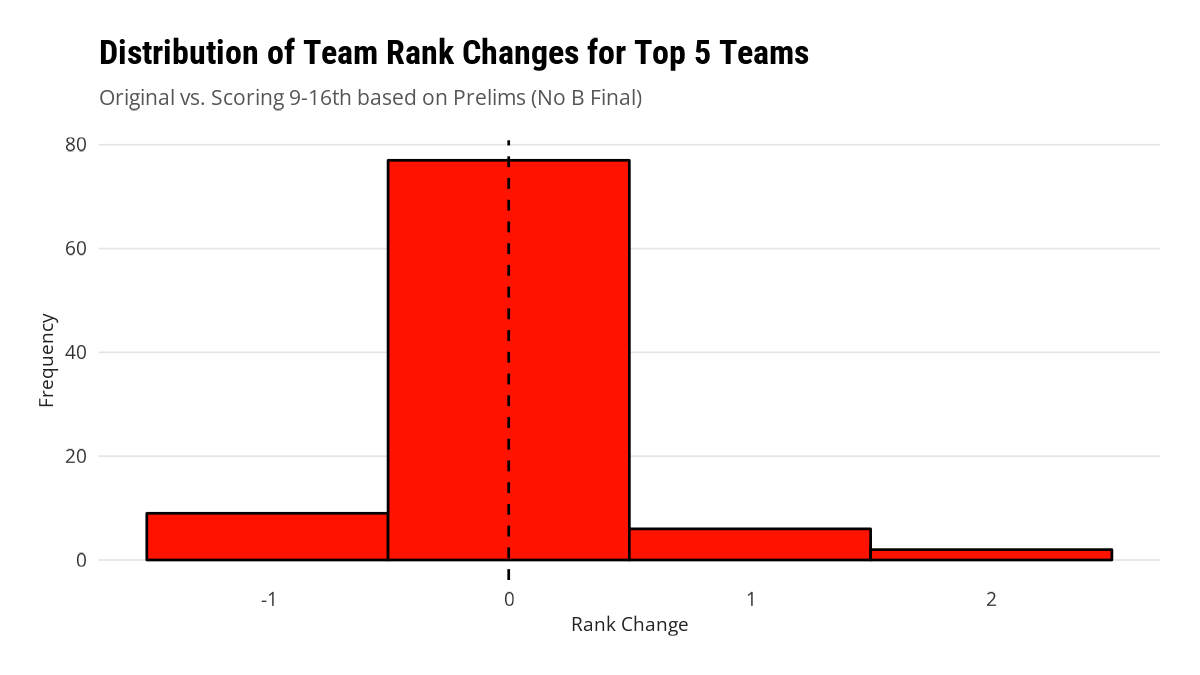
We can see in both cases that the top teams change ranks by significantly fewer spots. Across 94 top-5 teams in the dataset, only 17 changed their places at all, and only 2 shifted by more than 1 place. Granted, there is less room to move when you’re at the top of the list (e.g., if you’re the top team there is no way to move up 3 places), so we should expect a higher degree of consistency here by nature, but this still feels notable. The table below outlines the full list of top-5 teams with changes:
Table 5: All Rank Changes of Top-5 Teams
| Year | Gender | Team | Original Format Score | Original Format Rank | New Format Score | New Format Rank | Rank Change | Score Change (Original vs New) |
| 2019 | Women | NC STATE | 187.5 | 7 | 199 | 5 | 2 | 11.5 |
| 2018 | Men | INDIANA | 422 | 3 | 437 | 1 | 2 | 15 |
| 2025 | Men | CALIFORNIA | 471 | 2 | 471 | 3 | -1 | 0 |
| 2025 | Men | INDIANA | 459 | 3 | 477 | 2 | 1 | 18 |
| 2023 | Men | TEXAS | 384 | 3 | 369 | 4 | -1 | -15 |
| 2023 | Men | INDIANA | 379 | 4 | 380 | 3 | 1 | 1 |
| 2023 | Men | NC STATE | 373.5 | 5 | 359 | 6 | -1 | -14.5 |
| 2023 | Men | FLORIDA | 367.5 | 6 | 360.5 | 5 | 1 | -7 |
| 2021 | Men | LOUISVILLE | 211 | 5 | 207 | 6 | -1 | -4 |
| 2021 | Men | INDIANA | 207 | 6 | 211 | 5 | 1 | 4 |
| 2019 | Women | TEXAS | 190.5 | 5 | 197.5 | 6 | -1 | 7 |
| 2018 | Men | TEXAS | 449 | 1 | 433.5 | 2 | -1 | -15.5 |
| 2018 | Men | CALIFORNIA | 437.5 | 2 | 421.5 | 3 | -1 | -16 |
| 2017 | Men | STANFORD | 242 | 5 | 241.5 | 6 | -1 | -0.5 |
| 2017 | Men | SOUTHERN CALI | 237 | 6 | 245 | 5 | 1 | 8 |
| 2016 | Men | FLORIDA | 334 | 3 | 317 | 4 | -1 | -17 |
| 2016 | Men | NC STATE | 314 | 4 | 319 | 3 | 1 | 5 |
One particular case stands out: the 2018 Men’s Indiana team, with an improvement of 2 places, from 3rd to 1st.
This was a particularly close race for the title where Texas, Cal, and Indiana were separated by only 27 points. For context, it is the closest of all meets included in the analysis, the median score separation is 151 points, and only one other meet saw a gap less than 50 points (2025 Men’s championship).
Texas’ performances at night boosted their total by 15.5 points while Indiana’s diminished their total by 15 points – a large margin in both directions which, when combined, led to the swap.
Table 6: 2018 Men’s Top 3 Results
| Team | Original Score | Original Format Rank | New Score | New Format Rank |
| TEXAS | 449 | 1 | 433.5 | 2 |
| CALIFORNIA | 437.5 | 2 | 421.5 | 3 |
| INDIANA | 422 | 3 | 437 | 1 |
The hit for Indiana comes from a handful of small drops, such as Levi Brock falling from 10th to 16th in the 200 Breast final (-6 pts), Bruno Blaskovic falling from 13th to 16th in the 100 Free final (-3 pts), and Andrew Capobianco falling from 9th to 11th in the 1 MTR Diving final (-3 pts).
On the other hand, the jump for Texas is thanks to athletes like Jacob Cornish stepping up from 16th to 10th in the 1 MTR Diving final (+6 pts) and Jeff Newkirk improving from 13th to 9th in the 200 Free final (+5 pts).
This particularly unusual combination of rises and falls from Texas and Indiana respectively makes for a compelling story. However, this case is an exception, rather than the rule. What we’re observing overall is that the difference between the two scoring formats is typically marginal.
Statistical Analysis
We can further reinforce this by applying statistical analysis to compare the two scoring methods more formally. Specifically, we can use Spearman’s rank correlation coefficient to measure how closely the team rankings from each system align.
Looking at each meet individually, the correlation between the two scoring methods is consistently high. Across all meets, the coefficient ranges from 0.980 to 0.996, with an average of 0.991.
For context, a correlation coefficient of 1.00 indicates identical rankings between the two systems. As a general rule of thumb, anything above about 0.8 would be considered a strong correlation. The average of 0.991 indicates the two scoring systems produce nearly identical team rankings. And importantly, with the small range of .98 – .996, this connection is stable across many years and both genders.
We can observe this correlation visually on the scatter plot below. The dashed line represents an identical match, and the points cluster closely along it, demonstrating how well aligned the two systems are.
Conclusion
So, do B-Finals even matter? In terms of scoring outcomes, while there are a couple of interesting cases, the data suggests the answer is largely no. Overall, it’s a marginal change at best. The new format does not meaningfully alter where most teams finish in the rankings. The data tells this story pretty clearly.
Yet, team scoring and rankings are only a small part of the broader conversation about what the NCAA meet should be and who it should be for. The analysis alone doesn’t tell the whole story.
Beyond the rankings, how much value does a B-Final provide the athletes and their teams? Do athletes who once cut their teeth as B-Finalists in their early years have a tendency to grow into major scorers as upperclassmen, and if so, how much will this change alter that trajectory? Can stand-out performances from these athletes influence momentum swings for their teams?
On the other hand, does removing the B-Final meaningfully improve the experience for spectators and casual fans? Will we see improvements in broadcast numbers, in-person attendance, or overall revenue generation for the sport as a result of this change?
We may not yet have the whole story. It will take some time and more data before these questions can be fully explored, but if nothing else, this year’s meet will give us the first real look at how a small change on paper will start to ripple through the sport in practice.
Alternatively, if looking to overhaul things, why not take top-16 to finals and then score that. Plenty of times a 9-10 swimmer out swims a 6-8 swimmer and now, those people will actually move up in the standings.
A more interesting question is what would happen to results if they only scored 1 through 8?
I say this as someone who hates the elimination of B-finals; less racing = lamer viewing experience.
Great article BUT too centric on team outcomes. I would love some perspective and data for how the INDIVIDUAL athletes chances/opportunity to shine are effected by the loss of B final
Since they couldn’t figure it out by themselves and just shrugged as they canceled them, they should’ve reached out to people who understand their importance for creative suggestions.
I listened to the interview on their reasoning and that they wanted an accurate score at the conclusion of the broadcast.
Could start B finals at the commercial break and come in on the tail end of them if they last longer than the break. 1650 and 500, A heat only during the broadcast. The 500 B final swims before the broadcast. If you attend the meet, you can watch the A and B finals.
as an Australian this is interesting to see what happens. I think NCAA is a huge advantage for the US. Taking away B finals may not seem like much but I bet earning an evening swim is currently seen as a big thing for swimmers. Could this change along with others coming through be the start of this advantage watering down? Time will tell. Look at gymnastics. US always have a really strong Olympic womens team. Often have really strong men but not always a strong mens team.
When you flush a toilet, the water circles the drain the wrong way – Man fix that and THEN you can advise the USA what to do with NCAA swimming!
Confidence comes from reps of positive experiences. Finals swims (ones that have STAKES in the outcome of the meet), creates vital opportunities for leadership, team camaraderie, and a visible pathway towards growing a program and progressing as an individual athlete. While this doesn’t really affect the elite athletes already at the top of their events, it cheapens the end-of-season experience for many athletes who are late bloomers or are on the cusp of breaking out.
I’ve only ever been a high school and club coach, so I speak from a developmental perspective. However, my experience tells me that opportunities for personal growth happen during finals sessions. For instance, having an underclassman with high expectations miss their goal time or… Read more »
They should do what pro series meets do with c finals. Run all the a finals then all the b finals after. Don’t even need to be televised but the improvement for athletes is huge.
You’re “top 5 schools” seems drastically low. I’d expect at least Texas, Cal, ASU, Indiana, Florida, Tennessee, NC State, Georgia and LSU seem to be locks off the top of my head – and I’d expect reasonable chances at least for Stanford, Michigan and Virginia maybe? I agree it’s very top heavy, and B finals bring in more schools. But it’s not quite so ridiculous yet.
true, I looked at the 2025 men’s NCAA finals, the average is 6 teams. 200 back only 5 teams, and a few events 7.
This is awesome! Thank you for this!
Is there data for “lowest ranked qualifier to eventually score”? Would be interesting to see that data compared to the new changes as well…
Ever would be tough. We may be able to work it out for, say, the last decade.
Make it so.
That’s fair. And probably a good enough sample size to get the general idea…
at 2019 NCAAs, Izzy Ivey was ranked like 44th in the 100 back coming into the meet, and ended up placing 4th in the final.
That’s what kind of muddies the math a little bit. Most of the anecdotal situations that we can come up with are ‘swimmers who skipped an event at their conference meet and entered with a dual meet time that wasn’t reflective of their potential,’ which isn’t really the core of what the question is asking.
Ivey is a good example of that. She dropped the 200 free for the 100 back at NCAAs.
Good memory though. That was one we hadn’t thought of yet.
Yeah, however, she was invited in another event ranked much higher. I’m suggesting “what’s the lowest line someone got invited in and then scored (whether it be that event or a different one in the same meet)?”