
The NCAA released the official psych sheet for this year’s national meet yesterday. Scoring out the psych sheet (without diving) shows NC State in the lead by 10 points over Texas. Last year Texas turned a 31 point lead over NC State into a 190.5 point victory. Given recent history, that performance by Texas should not be considered surprising. Texas and California have been the clear leaders in dropping time at nationals vs seed among top D1 men’s teams.
Typical Performance vs Seed at Nationals
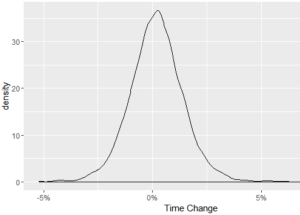
I pulled data from the past 7 seasons (2009/10 through 2015/16) for D1 men’s times entering nationals and at nationals and calculated the time change (calculated by:(Nationals time-Pre Nationals time)/Pre Nationals time, so a negative percentage means a swimmer got faster). Over that time period, swimmers added an average of .19% to their seed times at nationals with a standard deviation of 1.2% on 4045 data points. This is a smaller time add with higher volatility than D1 women over the same time period. The women added .45% on a standard deviation of 1% (the full write up on the women’s data). Here’s the men’s time change distribution:
There were 77 teams that sent an individual swimmer to nationals over the last 7 years, 8 of which dropped time on average from their seed times at nationals. Only 3 of those 8 had more than 10 swims at nationals, California dropped an average of .63% on 313 swims, Texas dropped .59% on 288, and Arizona dropped .18% on 217 (the complete table is below). In the women’s data, none of the big schools dropped time on average. The gap between California and Texas and the average time change for everyone else not from those two schools at this meet is around .9%. That’s remarkably large. Put another way, simply being from California or Texas instead of another school is worth almost a second on average vs a seed time in a 200.
For teams with more than 20 swims at a single national meet over the last 7 years, the top 7 performances and 12 of the top 15 performances by average time drop belong to California and Texas (the other 3 were Arizona, the complete table is below). The best single meet performance was California in 2012 when they dropped an average of 1% on 44 swims. Texas’s best was also 2012 when they dropped .9% on 37 swims. Neither Texas nor California ever added time on average in a single year. The best non Texas/California performance was Arizona in 2013 when the dropped .61% on 33 swims.
This year’s other top ranked team’s have mixed histories at this meet. NC State, this year’s top ranked team on the psych sheet only had 2 years with more than 20 swims at nationals, 2015 and 2016. They dropped .04% on 25 swims last year, but added .22% on 22 swims in 2015. Florida had a great year last year when the dropped .34% on 36 swims, but have also had some less stellar performances. In 2015 they added .35% on 38 swims and in 2013 added .28% on 39 swims. Indiana’s history is less than stellar. Overall they are the lowest ranked team with at least 100 swims over the last 7 years where they added an average of .57% on 108 swims. There were two years where they had more than 20 swims. In 2016 they added .88% on 21 swims, and in 2013 they added .71% on 24 swims.
Individual Performance
The biggest factor in how a team performs vs their seed is how heavily they rested at previous meets during the season. We can’t say for sure how much anyone rested thus far this season, but there are an awful lot of swimmers with exceptional resumes from Texas who aren’t ranked very high on the psych sheet (ex. Olympic champion Joseph Schooling is 11th in the 200 fly).
In the women’s data there was a clear difference between highly ranked swimmers who presumably hadn’t needed to rest as much to qualify and lower ranked swimmers. Women in the top 5 added an average of .06% vs .45% for the rest of the field. This gap was much smaller for men. Top 5 men’s swimmers added .06% (sd 1.1%) vs .21% (sd 1.2%) for the rest of the field. 50% of top 5 men dropped time time from their seeds vs 42% of swimmers ranked out side of the top 5 before the meet.
How Much Small Differences Matter
A few tenths of a percent one direction or another may not sound like a whole lot, but the margins in a meet as competitive as NCAA’s are pretty slim. The average distance between consecutive places in the top 16 on this year’s psych sheet is .18%. The difference for a team with 12 entries ranked in the top 16 between adding .2% on average and dropping .2% on average is at least 25 points. On the psych sheet (without diving) there are 5 teams with 12 or more entries in the top 16 ranked with 48 points of 1st place.
I included tables below with the team by team 7 year averages, the single year performances for large teams, and a list of the top individual performances vs seed at nationals over the last 7 years (there were 16 drops of more than 2.5%).
All Men’s Teams Average Percentage Time Changes at Nationals 2010-2016
| School | Average Time Change vs Seed | Number of Times | Standard Deviaion |
| Cincinnati | -0.93% | 3 | 0.33% |
| GW | -0.72% | 1 | |
| California | -0.63% | 313 | 1.16% |
| Texas | -0.59% | 288 | 1.34% |
| Arizona | -0.18% | 217 | 1.20% |
| WKU | -0.11% | 6 | 1.36% |
| Cleveland St | -0.10% | 3 | 0.98% |
| UMBC | -0.07% | 6 | 0.66% |
| Missouri | 0.00% | 72 | 0.90% |
| Georgia | 0.02% | 201 | 1.17% |
| Dartmouth | 0.03% | 4 | 1.82% |
| Wisconsin | 0.04% | 50 | 1.11% |
| Missouri St. | 0.04% | 17 | 0.77% |
| Stanford | 0.04% | 247 | 1.19% |
| Louisville | 0.06% | 114 | 1.13% |
| Saint Peters | 0.07% | 2 | 1.85% |
| Florida | 0.10% | 257 | 1.18% |
| Brigham Young | 0.18% | 14 | 0.94% |
| UC Davis | 0.18% | 3 | 0.36% |
| Old Dominion | 0.22% | 9 | 0.67% |
| Alabama | 0.25% | 59 | 1.36% |
| Michigan | 0.25% | 218 | 1.08% |
| Southern Cali | 0.29% | 183 | 1.29% |
| Minnesota | 0.30% | 74 | 0.96% |
| Arizona St | 0.31% | 25 | 0.67% |
| Kentucky | 0.32% | 35 | 1.20% |
| Utah | 0.35% | 28 | 0.82% |
| Eastern Mich | 0.35% | 11 | 0.86% |
| NC State | 0.35% | 76 | 0.87% |
| LSU | 0.38% | 40 | 1.47% |
| Virginia Tech | 0.42% | 57 | 1.28% |
| Ohio St | 0.43% | 116 | 1.00% |
| UNC | 0.44% | 101 | 1.09% |
| Cal Poly | 0.44% | 10 | 1.29% |
| Texas A&M | 0.46% | 57 | 1.13% |
| Auburn | 0.48% | 204 | 1.26% |
| Virginia | 0.50% | 102 | 1.24% |
| South Carolina | 0.50% | 35 | 1.27% |
| Penn St | 0.55% | 53 | 0.89% |
| Notre Dame | 0.56% | 48 | 1.14% |
| Columbia | 0.57% | 15 | 1.51% |
| Indiana | 0.57% | 108 | 1.11% |
| Davidson | 0.58% | 3 | 0.97% |
| Denver | 0.63% | 19 | 1.06% |
| UNLV | 0.63% | 50 | 1.17% |
| Tennessee | 0.64% | 84 | 1.33% |
| Clemson | 0.64% | 10 | 0.92% |
| Duke | 0.67% | 16 | 1.00% |
| Oakland | 0.68% | 7 | 1.15% |
| Gardner-Webb | 0.70% | 3 | 1.10% |
| TCU | 0.71% | 5 | 0.97% |
| Florida St | 0.71% | 52 | 1.08% |
| SMU | 0.72% | 14 | 1.61% |
| Penn | 0.74% | 22 | 0.95% |
| Michigan St | 0.78% | 14 | 1.52% |
| East Carolina | 0.78% | 5 | 0.73% |
| Northwestern | 0.78% | 22 | 1.09% |
| Iowa | 0.80% | 28 | 0.84% |
| Wyoming | 0.80% | 15 | 1.43% |
| Georgia Tech | 0.82% | 25 | 0.89% |
| Yale | 0.85% | 15 | 0.78% |
| West Virginia | 0.93% | 15 | 1.40% |
| Princeton | 0.95% | 29 | 1.37% |
| UNC Wilmington | 0.99% | 2 | 0.45% |
| Purdue | 0.99% | 26 | 1.10% |
| CSUB | 1.02% | 6 | 0.98% |
| Harvard | 1.08% | 27 | 0.89% |
| U.S. Navy | 1.17% | 15 | 1.22% |
| Cornell | 1.24% | 2 | 0.25% |
| UCSB | 1.25% | 10 | 0.64% |
| Air Force | 1.32% | 3 | 1.33% |
| Brown | 1.37% | 4 | 0.53% |
| Hawaii | 1.58% | 8 | 0.69% |
| Pittsburgh | 1.67% | 1 | |
| Boston U | 2.01% | 1 | |
| Loyola (MD) | 2.66% | 2 | 1.11% |
| Seton Hall | 2.77% | 3 | 1.58% |
Men’s Teams with At Least 20 Swims in a Single Year Average Percentate Time Changes at Nationals
| School | Year | Average Time Change vs Seed | Number of Swims | Standard Deviaion | |
| 1 | California | 2012 | -1.00% | 44 | 1.12% |
| 2 | Texas | 2012 | -0.90% | 37 | 1.09% |
| 3 | California | 2014 | -0.81% | 44 | 1.01% |
| 4 | California | 2011 | -0.77% | 48 | 0.97% |
| 5 | Texas | 2016 | -0.64% | 42 | 1.29% |
| 6 | Texas | 2015 | -0.62% | 46 | 1.21% |
| 7 | Texas | 2010 | -0.61% | 48 | 1.64% |
| 8 | Arizona | 2013 | -0.61% | 33 | 1.15% |
| 9 | California | 2010 | -0.57% | 45 | 1.09% |
| 10 | Texas | 2011 | -0.57% | 46 | 1.35% |
| 11 | Arizona | 2011 | -0.56% | 38 | 1.04% |
| 12 | Texas | 2014 | -0.55% | 42 | 1.35% |
| 13 | Arizona | 2010 | -0.53% | 40 | 1.24% |
| 14 | California | 2013 | -0.51% | 44 | 0.92% |
| 15 | California | 2015 | -0.42% | 42 | 1.46% |
| 16 | Georgia | 2016 | -0.41% | 29 | 0.87% |
| 17 | Florida | 2016 | -0.34% | 36 | 1.17% |
| 18 | Stanford | 2014 | -0.34% | 24 | 1.17% |
| 19 | California | 2016 | -0.31% | 46 | 1.38% |
| 20 | Stanford | 2012 | -0.29% | 45 | 1.25% |
| 21 | Alabama | 2016 | -0.29% | 20 | 1.24% |
| 22 | Georgia | 2012 | -0.28% | 22 | 1.38% |
| 23 | Stanford | 2011 | -0.16% | 37 | 0.99% |
| 24 | Florida | 2010 | -0.10% | 35 | 0.98% |
| 25 | Louisville | 2015 | -0.10% | 24 | 0.86% |
| 26 | Stanford | 2013 | -0.10% | 40 | 1.29% |
| 27 | Southern Cali | 2013 | -0.08% | 25 | 0.84% |
| 28 | Michigan | 2015 | -0.06% | 29 | 0.94% |
| 29 | Texas | 2013 | -0.06% | 27 | 1.33% |
| 30 | NC State | 2016 | -0.04% | 25 | 0.89% |
| 31 | Georgia | 2011 | -0.04% | 21 | 1.42% |
| 32 | Virginia | 2011 | -0.04% | 21 | 0.77% |
| 33 | Georgia | 2013 | -0.01% | 28 | 1.02% |
| 34 | Georgia | 2014 | 0.01% | 29 | 0.96% |
| 35 | Michigan | 2013 | 0.02% | 46 | 0.98% |
| 36 | Florida | 2012 | 0.05% | 32 | 1.61% |
| 37 | Southern Cali | 2014 | 0.07% | 25 | 1.14% |
| 38 | Southern Cali | 2012 | 0.07% | 21 | 0.93% |
| 39 | Ohio St | 2010 | 0.07% | 23 | 1.03% |
| 40 | Florida | 2014 | 0.08% | 39 | 1.07% |
| 41 | Auburn | 2014 | 0.11% | 22 | 1.01% |
| 42 | Arizona | 2014 | 0.13% | 26 | 0.94% |
| 43 | Stanford | 2010 | 0.16% | 36 | 1.16% |
| 44 | Southern Cali | 2011 | 0.19% | 28 | 1.02% |
| 45 | UNC | 2010 | 0.21% | 21 | 0.63% |
| 46 | NC State | 2015 | 0.22% | 22 | 0.77% |
| 47 | Virginia | 2010 | 0.25% | 20 | 0.90% |
| 48 | Auburn | 2011 | 0.26% | 36 | 1.12% |
| 49 | Florida | 2013 | 0.28% | 39 | 1.26% |
| 50 | Georgia | 2015 | 0.30% | 34 | 1.01% |
| 51 | Georgia | 2010 | 0.33% | 38 | 1.36% |
| 52 | Michigan | 2012 | 0.34% | 23 | 0.96% |
| 53 | Arizona | 2012 | 0.34% | 45 | 1.16% |
| 54 | Florida | 2011 | 0.34% | 38 | 1.07% |
| 55 | Southern Cali | 2010 | 0.35% | 23 | 1.02% |
| 56 | Michigan | 2014 | 0.35% | 32 | 0.78% |
| 57 | Florida | 2015 | 0.35% | 38 | 0.94% |
| 58 | Michigan | 2016 | 0.37% | 29 | 1.55% |
| 59 | Michigan | 2010 | 0.37% | 30 | 0.98% |
| 60 | Auburn | 2012 | 0.43% | 29 | 0.94% |
| 61 | Stanford | 2015 | 0.47% | 36 | 1.04% |
| 62 | Auburn | 2015 | 0.52% | 24 | 1.16% |
| 63 | Michigan | 2011 | 0.53% | 29 | 1.21% |
| 64 | Auburn | 2016 | 0.54% | 27 | 1.30% |
| 65 | Auburn | 2010 | 0.58% | 48 | 1.48% |
| 66 | Virginia | 2013 | 0.60% | 22 | 0.55% |
| 67 | Southern Cali | 2015 | 0.61% | 36 | 1.75% |
| 68 | Louisville | 2012 | 0.62% | 25 | 1.41% |
| 69 | Arizona | 2016 | 0.64% | 22 | 1.03% |
| 70 | Stanford | 2016 | 0.66% | 29 | 1.11% |
| 71 | Southern Cali | 2016 | 0.67% | 25 | 1.67% |
| 72 | Indiana | 2013 | 0.71% | 24 | 1.07% |
| 73 | Indiana | 2016 | 0.88% | 21 | 1.14% |
| 74 | Virginia | 2014 | 1.21% | 20 | 1.41% |
Top Individual Time Drops from Seed 2010-2016
| Name | School | Year | % Time Change | Event | Nationals Time | Seed | |
| 1 | Spann, Scott | Texas | 2010 | -5.20% | 200 Breastroke | 1:52.24 | 1:58.40 |
| 2 | Taylor, Hill | Texas | 2010 | -4.48% | 200 Backstroke | 1:41.55 | 1:46.31 |
| 3 | Walters, Dave | Texas | 2010 | -4.42% | 200 Freestyle | 1:33.04 | 1:37.34 |
| 4 | Darmody, Kip | Texas | 2014 | -4.37% | 200 Backstroke | 1:40.18 | 1:44.76 |
| 5 | Darmody, Kip | Texas | 2015 | -4.35% | 200 Backstroke | 1:41.47 | 1:46.08 |
| 6 | Turner, James | Florida | 2012 | -4.29% | 100 Freestyle | 43.75 | 45.71 |
| 7 | Bosch, Dylan | Michigan | 2016 | -4.16% | 100 Butterfly | 45.64 | 47.62 |
| 8 | Cragin, Cole | Texas | 2011 | -4.09% | 200 Backstroke | 1:42.04 | 1:46.39 |
| 9 | Cieslak, Marcin | Florida | 2012 | -4.00% | 100 Butterfly | 45.86 | 47.77 |
| 10 | Madwed, Dan | Michigan | 2011 | -3.96% | 100 Butterfly | 45.57 | 47.45 |
| 11 | Reynolds, Doug | Georgia | 2012 | -3.82% | 200 Freestyle | 1:37.08 | 1:40.94 |
| 12 | Camp, Parker | Virginia | 2012 | -3.62% | 100 Backstroke | 47.43 | 49.21 |
| 13 | Jakl, David | Columbia | 2015 | -3.59% | 200 Butterfly | 1:43.75 | 1:47.61 |
| 14 | Cordes, Kevin | Arizona | 2015 | -3.44% | 100 Breastroke | 50.25 | 52.04 |
| 15 | Murphy, Ryan | California | 2016 | -3.33% | 200 IM | 1:40.27 | 1:43.72 |
| 16 | Murphy, Ryan | California | 2014 | -3.32% | 200 IM | 1:42.24 | 1:45.75 |
| 17 | Bartlett, Matt | Georgia | 2011 | -3.31% | 200 Freestyle | 1:35.21 | 1:38.47 |
| 18 | Katis, Chuck | California | 2015 | -3.29% | 200 Breastroke | 1:50.54 | 1:54.30 |
| 19 | Nolan, David | Stanford | 2012 | -3.26% | 50 Freestyle | 19.6 | 20.26 |
| 20 | Burns, Owen | Virginia Tech | 2014 | -3.20% | 100 Freestyle | 43.83 | 45.28 |
| 21 | Almeida, Carlos | Louisville | 2012 | -3.15% | 200 Breastroke | 1:51.88 | 1:55.52 |
| 22 | Small, Adam | Arizona | 2011 | -3.11% | 100 Freestyle | 42.74 | 44.11 |
| 23 | Cragin, Cole | Texas | 2010 | -3.09% | 100 Backstroke | 46.11 | 47.58 |
| 24 | Friedemann, Mitchell | Arizona | 2013 | -3.08% | 200 Backstroke | 1:42.54 | 1:45.80 |
| 25 | Katis, Chuck | California | 2014 | -3.05% | 200 Breastroke | 1:52.64 | 1:56.18 |
| 26 | Blondell, Caryle | Louisville | 2013 | -3.04% | 100 Backstroke | 47.77 | 49.27 |
| 27 | Friedland, Eric | Texas | 2012 | -3.01% | 100 Breastroke | 52.46 | 54.09 |
| 28 | Tribuntsov, Ralf | Southern Cali | 2016 | -2.98% | 100 Butterfly | 46.27 | 47.69 |
| 29 | Pickard, Chris | Stanford | 2014 | -2.96% | 100 Freestyle | 43.97 | 45.31 |
| 30 | Jaeger, Connor | Michigan | 2013 | -2.94% | 200 Freestyle | 1:33.81 | 1:36.65 |
| 31 | Haas, Townley | Texas | 2016 | -2.93% | 200 Freestyle | 1:30.46 | 1:33.19 |
| 32 | Prenot, Josh | California | 2016 | -2.90% | 200 IM | 1:40.14 | 1:43.13 |
| 33 | Tarczynski, Marcin | California | 2012 | -2.89% | 200 IM | 1:41.97 | 1:45.00 |
| 34 | Fitton, Alex | South Carolina | 2013 | -2.88% | 50 Freestyle | 20.23 | 20.83 |
| 35 | Ress, Eric | Indiana | 2011 | -2.86% | 200 Backstroke | 1:38.96 | 1:41.87 |
| 36 | Appleby, Andrew | Ohio St | 2016 | -2.85% | 100 Freestyle | 43.57 | 44.85 |
| 37 | Stubblefield, Seth | California | 2012 | -2.85% | 50 Freestyle | 19.41 | 19.98 |
| 38 | Hoyt, Trevor | California | 2012 | -2.82% | 200 Breastroke | 1:51.90 | 1:55.15 |
| 39 | Switkowski, Jan | Florida | 2016 | -2.82% | 200 Freestyle | 1:32.14 | 1:34.81 |
| 40 | Murphy, Ryan | California | 2016 | -2.82% | 100 Backstroke | 43.49 | 44.75 |
Love this breakdown! Thank you.
Will there be a pick em contest this year? Not sure if the contest has been posted yet
Coach AU – there will be a contest, don’t have it up yet.
Texas and Cal swimmers qualify the same as everyone else. They choose to taper less or are better at going fast the second time around. Everyone had the same data to estimate what it will take to qualify so the significant difference is in the coaching staff (I think I have heard that Eddie is pretty good) and the psychology of the swimmers when they get to the big meet.
I am confused by David Nolan’s entry. I could have sworn he swam the 200 IM not the 50 free in 2012.
He did. That time is from a relay lead off from prelims of the 200 free relay. The source data for this doesn’t distinguish relay lead offs from regular times so lead offs are included. Can look at the split here: http://www.swmeets.com/Realtime/NCAA/2012/
I like the way Florida looks this year. I’ve never seen them qualify so many guys from a Last Chance meet. If the second-tier guys are dropping that much time with a few more days of rest and getting into NCs, it leads me to believe that the top tier group still has a lot left in the tank.
What about NC States DQs? Does that factor into this percentage rating?
No. If there was no official time at nationals, an event was ignored. Also this is individual times only. No relays.
The DQ curse now belongs to the PAC 12 with USC, Cal, and AZ all being bitten last year at NCAAs. Interesting how nobody talks about that or the fact that Tennessee had 2 DQs in 2015. NC State was a pioneer in using the wedge step over method. It was painful learning in the beginning but now even Dressel credits NC State for his fast relay exchanges.
But how you can DQ in prelims, get it overturned, and STILL DQ in finals when you would’ve won is indeed a STATE-ment.
The prelim dq was a timing malfunction The dq at night was too much excitement when the NC State 4th swimmer saw a lead of over a body length on Texas. He jumped by 0,01 seconds. He didn’t need a fast exchange because he finished well over a body length.
The most realistic way to pre-score the meet would be using swimmers personal best times. Since super talented swimmers from Cal and Texas don’t need to really shave and taper to qualify for NCAAs, it makes no sense to score a meet out with Schooling seeded as 11th. Wondering if someone already scored the meet using swimmers life time best times.
Didn’t qualification criteria change after 2012? Couldnt the better teams qualify people from relays alone and in some cases wouldn’t have to worry about individual entry times? So any data before then would be comparing apples and oranges, right?